Download
1 / 3
30 likes | 38 Vues
Google Analytics has several sections that you can use to track the behavior of your website visitors. <br>For example, monetization analytics can track publisher ads and in-app purchases to determine which <br>are the best performing items. They can also prompt you to remove items that arenu2019t working as well <br>as you would like. Another section, called retention, helps you measure your siteu2019s ability to retain <br>visitors and customers. You can access this section under Reports>User.

E N D
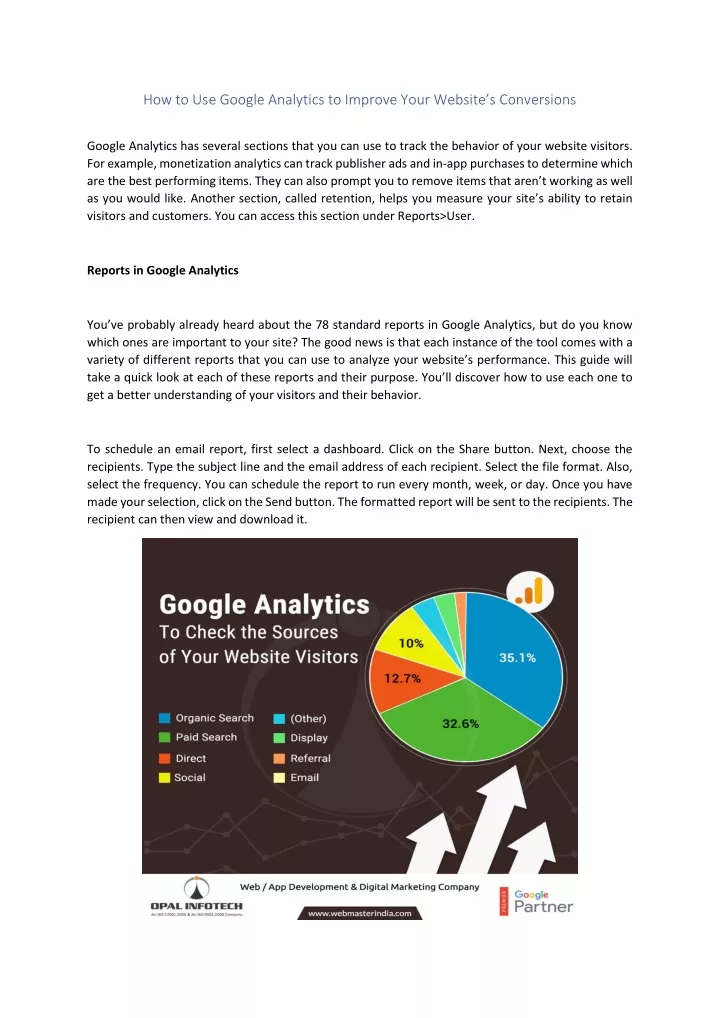
How to Use Google Analytics to Improve Your Website’s Conversions Google Analytics has several sections that you can use to track the behavior of your website visitors. For example, monetization analytics can track publisher ads and in-app purchases to determine which are the best performing items. They can also prompt you to remove items that aren’t working as well as you would like. Another section, called retention, helps you measure your site’s ability to retain visitors and customers. You can access this section under Reports>User. Reports in Google Analytics You’ve probably already heard about the 78 standard reports in Google Analytics, but do you know which ones are important to your site? The good news is that each instance of the tool comes with a variety of different reports that you can use to analyze your website’s performance. This guide will take a quick look at each of these reports and their purpose. You’ll discover how to use each one to get a better understanding of your visitors and their behavior. To schedule an email report, first select a dashboard. Click on the Share button. Next, choose the recipients. Type the subject line and the email address of each recipient. Select the file format. Also, select the frequency. You can schedule the report to run every month, week, or day. Once you have made your selection, click on the Send button. The formatted report will be sent to the recipients. The recipient can then view and download it.
Creating custom dimensions and metrics in Google Analytics If you’re using Google Analytics on your website, you may have wondered how to create custom dimensions. These measurements measure the amount of traffic generated from a specific source. To create custom dimensions, you must first create a tracker on your website. A custom dimension will require you to specify the dimensions’ name, scope, and state. By default, GA will process the values of a custom dimension only when they match those found in the admin section of your property. Using custom dimensions and metrics in Google Analytics is very straightforward. First, you must understand the scope of each measurement. In other words, if your site is an e-commerce website, you can use product-level measurement to measure how many people have bought a certain product. Likewise, if your website tracks visitor action, you can use a hit-level measurement to measure the total number of times someone has visited a page or took a specific action.
Setting up a Google Analytics account If you’re not familiar with Google Analytics, you’ll want to take a look at the basics before getting started. Once you’ve set up your account, you can track your properties by creating a tracking ID. This unique code helps Google gather data from your website. You’ll also need to enter a unique account name, your website’s URL, and an industry category. This will help Google identify which properties are bringing in the most traffic. Next, you’ll need to choose the tracking ID that’s unique to your website. This number is usually in the form of a unique ID that’s prefixed with UA. Once you have that, you can begin using Google Analytics for SEO to gather data about your website. You’ll be able to view your website’s traffic, conversions, and other metrics using the features listed on the left side of the screen. Using Google Tag Manager to integrate Google Analytics with Google Tag Manager Using Google Tag Manager to integrate your website with Google Analytics is a great way to keep track of your traffic and improve your conversions. Google offers free tools to help website owners and marketing professionals analyze their websites. While over 27 million websites use Google Analytics, only about 4 million have Google Tag Manager installed. Google Tag Manager is a popular choice for website owners because it allows them to manage and centralize marketing tags. They also offer debug and preview modes so that they can see what tags are firing on a page. Once you’ve configured your Google Analytics installation, you can choose to enable integration with Google Tag Management for specific tests. Once you’ve enabled integration with Google Tag Manager, you’ll need to set up a version description for each test. In order to use Google Tag Manager to integrate with Google Analytics, you must select a different tag, variable, and trigger for each test. In addition, you can create and manage custom dimensions for your Google Analytics reports.
