Download
1 / 40
400 likes | 1.06k Vues
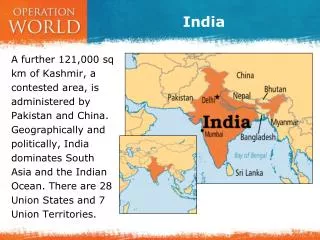
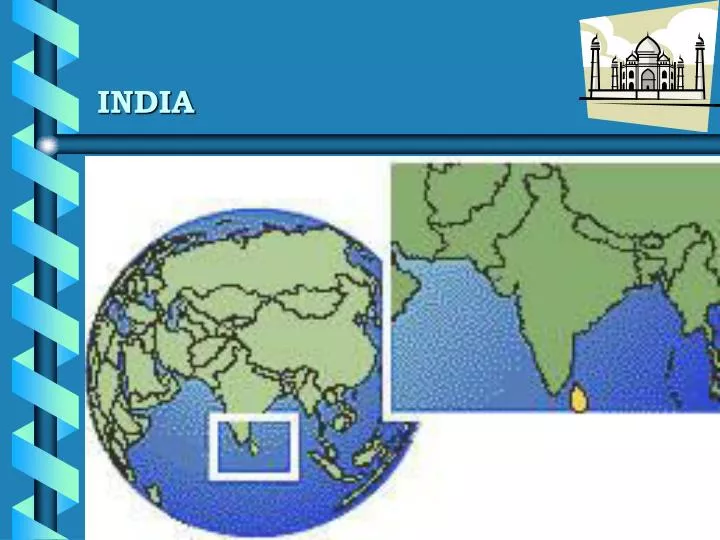
INDIA. INDIA OVERVIEW. LOCATED IN THE SOUTHERN TIP OF ASIA. LIES ENTIRELY IN THE NORTHERN HEMISPHERE. MAINLAND OF INDIA: North to South 3,200 kms. East to West 2,900 kms. Area is 7 th largest in the World. Land frontier 15,000 kms. Coast line 6,100 kms.

E N D
INDIA OVERVIEW • LOCATED IN THE SOUTHERN TIP OF ASIA. • LIES ENTIRELY IN THE NORTHERN HEMISPHERE. • MAINLAND OF INDIA: • North to South 3,200 kms. • East to West 2,900 kms. • Area is 7th largest in the World. • Land frontier 15,000 kms. • Coast line 6,100 kms. • POPULATION 1.025 Billion • CLIMATE Monsoon tropical to Mountainous Arctic.
INDIA OVERVIEW (contd.) • LANGUAGES: 17 major; 844 dialects • LANGUAGES OF THE CONSTITUTION : Hindi & English • POLITICAL SYSTEM : Secular, Socialist, Federal, Democracy. • STRUCTURE : 29 Federative States + 6 Union Territories • CURRENCY : INDIAN RUPEE ( INR ) • Equivalency ( Feb. 1st, 2003) • - US$ 1 = INR 47.75 • - Euro = INR 51.60 • - NOK = INR 6.85 • *PER CAPITA GNP : US$ 500+ • * LIFE EXPECTANCY : 65 years
INDIAN ECONOMY : GROWTH • Q1+ Q2(Fiscal 2002-03)Q1+ Q2(Fiscal 2001-02) • GDP Growth 5.2% 4.4% • Agriculture 2.5% 3.3% • Services 7.5% 5.5% • Finance/Insurance 8.9% 7.6% • Hotels, Communica- • tions etc. 8.0% 2.4% • *Industry 5.1% 2.1% • Capital goods 8.9% 6.8% • Basic Engineering 4.8% 2.1% • Consumer,non durable 14.8% 2.8% • Core Industrial 5.6% 2.5% • Overall BOP Surplus $ 6,685 million $ 1,904 million
INDIA : FOREIGN EXCHANGE • YEAR 2002YEAR 2001 • RESERVES $ 78 billion $ 56 billion • IMPORT COVER 15 months 11.5 months • RESERVES/GDP 13.9% 10.2% • India now 8th largest holder of forex stock in the world. • India`s import cover 2nd highest(after Japan) of major economies. • China has 11 months cover.
INDIA`S FOREIGN TRADE • US$ Million • `99-`00`00-`01`01-`02 • *Exports 37599 44035 43998 • *Imports 47212 50113 50654 • *Balance - 9613 - 6078 - 6655 • *Main Exports • Gems & Jewellery • Engineering Goods • Garments • *Main Imports • *Petroleum etc. • *Machinery & Chemicals • *Precious Stones etc.
INDIA: EFFECTS OF IRAQ WAR ANTICIPATED WORST CASE SCENARIO: - Oil Prices may go up to $45 per barrel. - Inflation will jump from 4.5% to 6%. - Impact will persist through Year 2004. - GDP growth will decrease by 1%. - Manufacturing and IT sectors will be hit badly. - Indian Rupee will cross limit of INR 50= US$ 1
INDIA`S TRADE WITH NORWAY • (US$ Million) • `99-`00`00-`01`01-`02 • Exports 51.32 60.39 54.30 • Imports 43.01 46.85 47.98 • Balance 8.31 13.54 6.32 • Main Exports • Clothing/Apparel • Leather Products • Main Imports • Elec. Machinery • Organic Chemicals • Nickel etc.
INDIA- FOREIGN INVESTMENT • NETT FDI INFLOWS (US$ Millions) • YEAR 2002YEAR 2001 • Jan – Mar 1,192 500 • Apr-Jun 1,066 609 • Jul 422 481 • Aug 170 660 • FISCAL 2001-02FISCAL 2000-01 • NETT FDI (US$ Billions) 4.06 2.46 • NETT FDI up by 65% • Source: World Bank / CII Investment report
DESTINATION OF FDI BY INDUSTRY (YR : 2001) (US$ Millions)
INDIA vs CHINA - 2INVESTMENTS & PRODUCTIVITY(Source : Intl. Finance Corp.)
INDIA : BASE CONDITIONS • NEGATIVES • High Import duties. • High cost of finance. • Infrastructure deficiencies. • Heavy Bureaucracy. • High cost of power / Inefficiencies. • Convoluted Tax and duty structure. • Problematic labour laws.
INDIA : BASE CONDITIONS • POSITIVES • Excellent skilled Engineers /Managers/ Professionals. • Competitively priced human resources. • International level IT and Biotech skills. • Excellent design and development skills. • Good multidisciplinary skills e.g. Bioinformatics. • Very large biodiversity resource. • Positive encouragement to Renewable Energy.
INDIA : MACRO ANALYSIS • On basis of positives and negatives: • Maximum potential in knowledge based areas: ICT, Bio etc. • A) For exports: • Software • IC Chip designing / other design activities • ITES / BPO / Call Centres • Geographical Information Systems • Data Mining / Drug testing - CRO • Biotech / Bioinformatics • B) For domestic market • Telecom • Software products e.g. ERP,CRM etc. • Specialised software e.g. CAD • Smart Card systems • Pharma
INDIA : MACRO ANALYSIS • OTHER POTENTIAL AREAS OF INTEREST • Renewable Energy • Solar , Wind, Small Hydro, Biomass • Pharmaceuticals from biodiversity. • Healthcare • Infrastructure • Shipping / Marine / Infrastructure
INDIA : MACRO ANALYSIS • POTENTIAL FOR MANUFACTURING • Due to the `negatives`, following are more viable: • For Export – • Only items where local value added very high through labour • materials, components e.g. Leather goods, garments/textiles, • polished diamonds/jewellery. • *For the Indian market – • A)Large demand volumes: • *Items with high value added & minimal imports e.g. Scooters • *Process oriented items with minimal imports e.g. Cement • *Fast moving consumer & food processing items with minimal • imports e.g. toiletries, mineral water etc.
INDIA : MACRO ANALYSIS • POTENTIAL FOR MANUFACTURING • For the Indian market – • B) Small to medium demand volumes: • *High cost items with high local value added e.g. pumps. • *Bulky, large weight/volume items where freight costs for • imported equivalents is significant. • *Specialty high value items particularly of strategic • importance e.g. transducers / sensors.
INDIA : OFFSHORE SECTOR • Started in 1970 with finding of oil in Bombay High. • Initial exploitation only by public sector. • Oil accounts for 30% of India`s energy consumption. • India`s Oil consumption: • Year 2000: 2 million barrels per day • Year 2010: 3 million barrels per day • *India`s average crude oil production: 800,000 barrels/day. • *Of which 250,000+ barrels per day from Bombay High. • *Strategic requirement to increase domestic production.
INDIA: OFFSHORE SECTOR • Govt. announces “New Exploration Licensing Policy” (NELP) • Encouragement to private and foreign sectors. • NELP(I):Year 2000; NELP(II):Year 2001; NELP(III):Year 2003 • Only about 25% of sedimentary basin totally explored. • About 55% totally unexplored. • Contracts for 70 blocks signed in last 3 years. • Main players: Reliance, Niko, Hardy, Cairn, Geopetrol, Heramec. • Needs investment of US$ 50 billion+ in next 15 years. • 7 discoveries made, estimated at 250 million tonnes
INDIA :SHIPS & SHIPPING • INDIAN SHIPPING FLEET ( not incl. Coastals, Barges, lighters etc.): • 515 ships , growth: 6% p.a. • GRT - 7.1 Million Tonnes, growth: 1.7%; target: 5% p.a. • DWT – 11.5 million tonnes. • Reduction in average size of ships. • Caters predominantly to domestic shipping. • INDIAN SHIPOWNERS SHARE IN INTL. TRADE: • By Volume - 30% • By Value: - 12% • PRINCIPAL SHIPPING LINES: • Shipping Corpn. Of India ( Public Sector but to be privatised) • Great Eastern • Essar • Varun
INDIA : SHIPBUILDING • INDIAN SHIPYARDS: • 4 major and seven medium sized (all in public sector). • 35 smaller sized, all in private sector. • GOVT. OWNED SHIPYARDS: • Poor quality • Cost overruns • Delayed deliveries • High cost ( principally high cost of steel) • Candidates for privatisation (Kvaerner talking to Hind. Shipyard) • PRINCIPAL SOURCE OF SHIP SUPPLY : South Korea • PRIVATE SHIPYARDS: • -More efficient, especially the smaller ones. • -Poor infrastructure. • -ABG Shipyards made Newsprint Carriers for Lys Lines (Norway).
INDIA : PORTS • SEAPORTS HANDLE 95% OF CARGO TO & FROM INDIA. • SEA CARGO AT INDIAN PORTS: • Year 2002-03 390 million tonnes • Year 2006-07(est.) 540 million tonnes • PORTS: • 12 major ports , handle 75% of seaborne trade (Public Sector) • 140 minor ports of which 25 are very active.( State & Private) • 5 new private deep water ports in offing • A few captive ports as well • US$ 30 billion investment made last ten years for modernisation • US$ 50 billion expected next ten years • Average turn around time reduced from 7.84 days to 3.7 days. • Changing from `Service Port` to `Landlord port` model. • Incentives and concessions for investment in ports
INDIA : CONTAINER TRAFFIC • CONTAINER CARGO: • In 1990-91 7.62 million tonnes (0.68 million TEU`s) • In 2001-02 37.23 million tonnes (2.44 million TEU`s) • By 2006-07 105 million tonnes (6.9 million TEU`s) • CAGR of 14%. Compare with 7 to 8% for overall cargo. • MAIN CONTAINER PORTS: • -NHAVA SHEVA (NS) PORT ( New Mumbai) • a)Jawaharlal Nehru Port Trust: handles 70% of India`s traffic, and • is world`s 3rd fastest growing container port. • b)NS International Container Terminal/P&O Ports. • -Cochin (Vallarpadam) • -Vizaq (Visaka) • -Chennai • -Tuticorin • -Kandla
INDIA : BULK SHIPPING • LIQUID BULK 110 million tonnes CAGR 7.1% • Crude Oil • Petroleum products • DRY BULK 100 million tonnes CAGR 6.4% • -Iron Ore • -Coal • -Fertilizers & raw materials • -Food grains • BREAK BULK 15 million tonnes CAGR 5% • 70% bulk cargo handled in major ports of India • 30% bulk cargo handled in minor ports of India • Draft restrictions at Dry Bulk Ports means use of smaller ships: • - Only Panamax, Aframax and Handymax ships.
INDO-NORWEGIAN VENTURES • INDIAN CO.NORWEGIAN CO.ITEM • Acto Information Norman Data Defense Software • A.Power Moeller Energi Small Hydro • Annapurna Kennmore Laiberg Holding Refrig. items • Carbon Everflow Flowtite Plastic Pipes etc. • CP Engineering Algas Fluid Microfilters etc. • Elva Induction Elva Induksjon Induction heaters • Eltek SGS Eltek Telecom • Fluro Start Glamax Lighting • Garden Reach Ulstein Diesel Engines • Hydro Coatings Norsk Hydro Speciality coating • Hydro Norinco Norsk Hydro Hydrogen plants • Hydro S&S Norsk Hydro Petrochemicals • Indal Hydro Norsk Hydro Aluminium items • Jordan Dental Care Jordan Toothbrushes • Kvaerner Powergas Kvaerner Consultancy • Maritime Hydraulics Maritime Hydraulics Oilfield eqpt. • Nera India Nera Networks Telecom • Norcool India Norcool AS Refrigeration • Etc. etc.
INDO-NORWEGIAN VENTURES Machinery : 10 Shipping /Maritime: 9 Information Tech: 6 Chemicals & Petro: 6 Electrical/Electronics: 5 Metallurgy: 4 Refrigeration: 3 Telecom: 2 Gases: 2 Others: 16
THANK YOU • Anand K. Sethi • Managing Director • Applied Technology Services Pvt. Ltd. • 14-F, Basant Lok; Vasant Vihar • New Delhi 110057; INDIA
INDIA : FISHING SECTOR FISH PRODUCTION ( million tonnes) 1998-99 : 4.25 2000-01 : 5.65 2001-02 : 6.0 - Marine Sector = 50%; Inland Sector = 50%. - Provides employment to 6 million fishermen. FISH PRODUCTION POTENTIAL: 8.4 million tonnes POTENTIAL UTILISATION: 65% only EXPORTS: $ 1.3 billion ( Year 2001 ) TOTAL INVESTMENT: $ 700 million TOTAL OVERSEAS INVESTMENT: $ 175 million MAIN VARIETIES: prawns, shrimp, tuna, cuttlefish, squids, octopus, red snapper, mackerel, catfish, lobster, ribbon fish.
INDIA : INFRASTRUCTURE * National Highways program outlay: $ 11.25 billion * National Highways (Golden Quadrilateral) : 5,846 kms by 2003 * Multilaning of 7,300 kms of National Highways * Indian Railways Golden Quadrilateral program: $ 2 billion * Major Power sector reform - New Electricity bill in 2003 * Major emphasis on Hydro Power ( approx 8000 MW ) * Other important infrastructure initiatives: - New and privatised Airports. - National Water initiative. - Special Economic Zones. - Urban Infrastructure improvement. - Rural Infrastructure improvement. - Solid waste management projects