Download
1 / 76
820 likes | 1.31k Vues
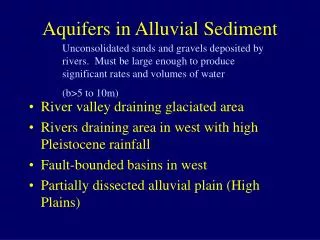
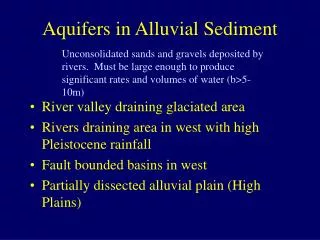
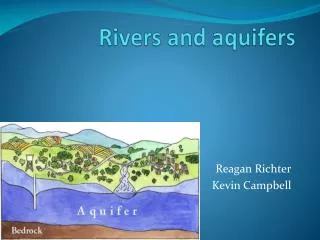
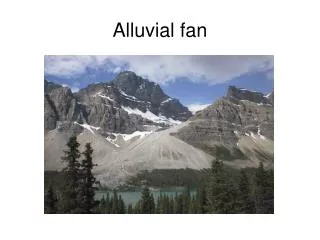
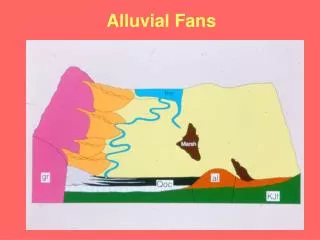
Aquifers in Alluvial Sediment. Unconsolidated sands and gravels deposited by rivers. Must be large enough to produce significant rates and volumes of water from wells. River valley draining glaciated area Fault bounded basins Partially dissected alluvial plain (High Plains)

E N D
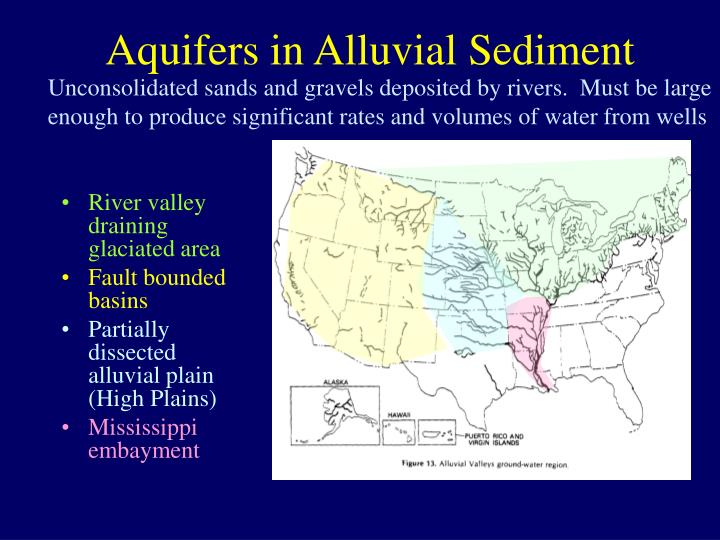
Aquifers in Alluvial Sediment Unconsolidated sands and gravels deposited by rivers. Must be large enough to produce significant rates and volumes of water from wells • River valley draining glaciated area • Fault bounded basins • Partially dissected alluvial plain (High Plains) • Mississippi embayment
Sea vs. Closed Basin as Drainage Destination for Alluvial Sediments Sea • Suspended load possibly removed • Salts possibly removed • Sea level change important • Closed Basin • Fine-grained seds in system • Salts remain • Isolated from effects of sea level change • Affected by local climate
Alluvial sediments in glaciated areas • Glaciers advance, scour seds., modify river course. Sed comp. depends on location/source material. Large range of grn size. Till=clay-boulder beneath glacier. • Sea-level drops as ice advances. Hydraulic gradient increase. Erosion, velocity, carrying capacity increase. Valleys incised into bedrock, older glacial sediments (cover earlier channel deposits) • Glaciers recede. Discharge increases. Erosion. Braided rivers, large sediment capacity. Outwash plain (sands and gravels). Lakes in front of receding glaciers. Lacustrine=clay-silt (varved)
Alluvial sediments in glaciated areas, Cont • Sea level rises, glaciers recede, hydraulic gradient diminishes, discharge diminishes, carrying capacity drops. Style changes from braided to meandering. Lakes. • Coarse-grn seds deposited in incised valleys. Gravel on bottom, fining upward. Thickness depends on conditions during/following glaciation. Glacial landforms • Region adjusts to interglacial. Discharge decreases. Sediments reworked. • Important materials: Till, lacustrine, outwash, alluvial valley fill, diamicton, drift. Complex facies distributions
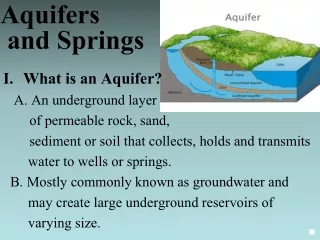
AlluvialAquifer Systems • Geometry • Aquifer type • Properties • Recharge/Discharge • Flow pattern • Chemistry • Examples
1:100 Geometry • Channel deposits • Elongate, tabular bodies, sinuous Length: many km Width: 0.1-several km Thickness: 0.01-0.1 km • Outwash deposits, alluvial plain • planar sheets 10s km horizontally Thickness: 0.01-0.1 km 1:10
Aquifer Types • Unconfined • Confined • Both, unconfined with local confining unit Deposits • Channel fill in modern valley • Buried channel • Outwash plain • Alluvial plain
Confining unit where fine grained Sand and gravel, Primary aquifer Idealized setting Channel fill in modern valley substratum
Storativity of major alluvial aquifers confined unconfined
Fining upward sequences in major alluvial aquifers Estimate how K varies with depth in alluvial aquifers? Straight line on log*log plot d50=C*Zb Log(20)-Log(3)=0.82 b=Slope=2/0.82=2.4 d50=C*Z2.4 Hazen method K=C1d102 Alluvial: K=C2Z4.8
Infiltration through floodplain Losing stream including tributary Stormflow off uplands Recharge to alluvial aquifers
Irrigation return flow Rise in river stage, Bank storage Rise in river stage, Flood
Discharge from basement Main channel losing due to pumping
Discharges from Alluvial Aquifers • To main channel or tributaries • Lakes on floodplain • Wetlands • Wells
Streambed conductance effects on gw/sw interaction Fine-grained seds on streambed Fine-grained seds in topstratum
10 Stream-parallel flow, Neither gain nor lose 9 Losing reach 10 9 Gaining losing Gaining reach Preliminary interpretations of gw-sw interactions using head contours 10 9 10 2. 3. 9 1. 4.
Some examples • Fox-Wolf River Basin, WI. Outwash • Corning aquifer, NY. River valley • Andruscoggin. ME. Alluvial valley once inundated by seawater • Irondogenese, NY, Alluvial valley once filled with fresh water lake • Others
Wisconsin Dome
140 miles 20 miles Fox-Wolf River Basin
Buried pre-glacial valley, now covered by till and lacustrine deposits
What does this map tell you about the Fox-Wolf River aquifer? Regional GW flow patterns? Where are thr recharge and discharge areas? What controls? Expected fluxes? GW discharge area? 30 miles
Baseflow rate related to T of surficial aquifer Composition of GW and SW similar
Ground water flow through surficial aquifer, Paleozoic sandstones, and discharge to river
Conceptual Model Recharge Streams Cape Cod Bay Fine-grained Sand/Silt Groundwater Flow Paths Saline Groundwater Bedrock Glacial Till Freshwater/Saltwater Interface South North
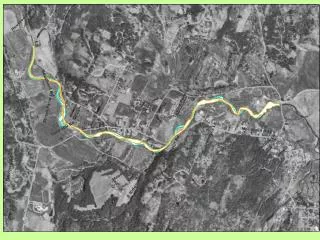
Chemung river valley, Corning, NY Limestone and shale bedrock on rounded hills 800 ft or more above the sand and gravel aquifer on the valley floor.
1 mile 5 miles
4000 1:40 aspect ratio
A. Corning Aquifer Exercise 3000 ft • Determine the horizontal head gradient at each location • Estimate the ground water fluxes at each location • Estimate the average flow velocities • Estimate the volumetric rate per unit length of river that the aquifer is contributing to the rivers at each location. • Provide an explanation for the differences between the two locations B.