Download
1 / 23
230 likes | 554 Vues
Phylogeny and trait values. A phylogeny describes a hypothesis about the evolutionary relationship between individuals sampled from a populationDiscrete character traits of interest can be mapped onto the phylogenyA significant association between a particular trait value and its distribution on a phylogeny indicates a potential causative relationship.

E N D
1. Correlating traits with phylogenies Using BaTS
2. Key point: students should understand
Phylogenies as hypotheses about ancestry
Discrete nature of character traits
Possible traits, e.g. geographic, tissue-based, molecular characterization, etc.
Associations must be significant given potential for Type I error (especially by eye)Key point: students should understand
Phylogenies as hypotheses about ancestry
Discrete nature of character traits
Possible traits, e.g. geographic, tissue-based, molecular characterization, etc.
Associations must be significant given potential for Type I error (especially by eye)
3. Phylogeny and trait values A phylogeny describes a hypothesis about the evolutionary relationship between individuals sampled from a population Key point: students should understand
Phylogenies as hypotheses about ancestryKey point: students should understand
Phylogenies as hypotheses about ancestry
4. Phylogeny and trait values Discrete character traits of interest can be mapped onto the phylogeny Key point: students should understand
Discrete nature of character traits
Possible traits, e.g. geographic, tissue-based, molecular characterization, etc.Key point: students should understand
Discrete nature of character traits
Possible traits, e.g. geographic, tissue-based, molecular characterization, etc.
5. Phylogeny and trait values A significant association between a particular trait value and its distribution on a phylogeny indicates a potential causative relationship Key point: students should understand
Associations must be significant given potential for Type I error (especially by eyeKey point: students should understand
Associations must be significant given potential for Type I error (especially by eye
6. Phylogeny and trait values Often, the phylogeny-trait relationship does not appear unequivocal by eye: an analytical framework may be needed. Key point: students should understand
Associations must be significant given potential for Type I error (especially by eye
Key point: review
Key point: null hypothesisKey point: students should understand
Associations must be significant given potential for Type I error (especially by eye
Key point: review
Key point: null hypothesis
7. Phylogeny and trait values The null hypothesis
The null hypothesis under test is one of random phylogeny-trait association; that is, that
�No single tip bearing a given character trait is any more likely to share that trait with adjoining taxa than we would expect due to chance� Key point: null hypothesis
Key point: null hypothesis
8. An example Salemi et al (2005)*: Dataset of HIV sequences sampled from CNS tissues post mortem
Analysis by Slatkin-Maddison (1989) method, reanalyzed in BaTS**.
Compartmentalization by tissue type: circulating viral populations defined by location in the body:
*Salemi et al. (2005) J. Virol 79(17): 11343-11352.
**Parker, Rambaut & Pybus (2008) MEEGID 8(3):239-246. For illustration only � no interpretation at this pointFor illustration only � no interpretation at this point
9. Available methods Non-phylogenetic: ANOVA
Ignores shared ancestry
Phylogenetic:
Single tree mapping
Slatkin-Maddison & AI
BaTS Overview of available methods, including BaTS.Overview of available methods, including BaTS.
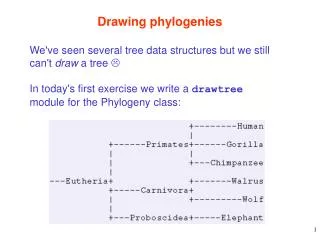
10. Methods: Single-tree mapping Method:
Map traits onto a tree
Look for correlation
Pros:
Fast
Simple
Cons:
No indication of significance
Statistically weak (high Type II error)
Conditional on a single topology Discuss:
What is involved?
Have the students encountered any of these methods before?
What are the pros and cons?Discuss:
What is involved?
Have the students encountered any of these methods before?
What are the pros and cons?
11. Methods: Slatkin-Maddison & AI Method:
Map traits onto a tree by parsimony & count migration events (Slatkin-Maddison) or measure �association index� within clades recursively (AI)
Compare observed value with a null (expected) value obtained by bootstrapping
Pros:
Still reasonably fast
Indication of significance
Cons:
Still conditional on a single topology Discuss:
What is involved?
Have the students encountered any of these methods before?
What are the pros and cons?
Discuss:
What is involved?
Have the students encountered any of these methods before?
What are the pros and cons?
12. Methods: BaTS Method:
See below(!)
Pros:
Indication of significance
Statistically powerful and Type I error is correct
Accounts for phylogenetic uncertainty
Cons:
Requires Bayesian MCMC sequence analysis
Slower Discuss:
What is involved?
Have the students encountered any of these methods before?
What are the pros and cons?
Key point: Students should understand:
BaTS calculates proper null distributions to calculate significance.
BaTS statistics have been tested and Type I error found to be correct, as well as powerful.
Because BaTS is a Bayesian MCMC approach, it corrects for phylogenetic uncertainty. That is, all different phylogenies are included in the posterior set in proportion to their support in the data � bootstrapping techniques only test a single phylogeny.
Discuss:
What is involved?
Have the students encountered any of these methods before?
What are the pros and cons?
Key point: Students should understand:
BaTS calculates proper null distributions to calculate significance.
BaTS statistics have been tested and Type I error found to be correct, as well as powerful.
Because BaTS is a Bayesian MCMC approach, it corrects for phylogenetic uncertainty. That is, all different phylogenies are included in the posterior set in proportion to their support in the data � bootstrapping techniques only test a single phylogeny.
13. BaTS: under the bonnet Use a posterior distribution of phylogenies from Bayesian MCMC analysis
Calculates migrations, AI and a variety of other measures of association
Both observed and expected (null) values� posterior distributions sampled
Significance obtained by comparing observed vs. expected Key point: exact working and philosophy not important at this stage. See Parker et al. (2008) for details.
Key point: Students should understand:
A Bayesian MCMC analysis is a prerequisite step
BaTS uses the posterior distribution of phylogenies as input
Null (expected) and observed distributions are compared.
Observed values are less important than significance.
Key point: exact working and philosophy not important at this stage. See Parker et al. (2008) for details.
Key point: Students should understand:
A Bayesian MCMC analysis is a prerequisite step
BaTS uses the posterior distribution of phylogenies as input
Null (expected) and observed distributions are compared.
Observed values are less important than significance.
14. BaTS: analysis workflow Preparation:
Sequence alignment
Bayesian MCMC phylogeny reconstruction (BEAST, MrBAYES) to obtain posterior distribution of trees (PST)
Taxa in PST marked up with discrete traits
BaTS analysis
Interpretation
15. Workflow: Preparation (i) Sequence alignment:
CLUSTAL, BioEdit, SE-Al
Bayesian MCMC analysis:
MRBAYES, BEAST
Taxa marked-up with traits
Students may have their own preferred third-party software: not relevant to BaTS how the analysis proceeds up to the bMCMC stage.Students may have their own preferred third-party software: not relevant to BaTS how the analysis proceeds up to the bMCMC stage.
16. Workflow: Preparation (ii) Taxa marked-up with traits:
Typical NEXUS format:
Illustration of typical #NEXUS format.
Check students are familiar and comfortable with the basic #NEXUS DOM / data structure before moving on.Illustration of typical #NEXUS format.
Check students are familiar and comfortable with the basic #NEXUS DOM / data structure before moving on.
17. Workflow: Preparation (iii) Taxa marked-up with traits: The BaTS markup.
Load dataset example.trees to inspect.
Students should:
Be competent and confident in:
opening a #nexus file in a text editor,
editing by hand for BaTS,
and saving as a new BaTS input file.
Understand how BaTS� input parser differs.
Pay attention to whitespace, capitalization and trait labelling
Bear in mind that mis-typed input traits will be parsed as another discrete state.
The BaTS markup.
Load dataset example.trees to inspect.
Students should:
Be competent and confident in:
opening a #nexus file in a text editor,
editing by hand for BaTS,
and saving as a new BaTS input file.
Understand how BaTS� input parser differs.
Pay attention to whitespace, capitalization and trait labelling
Bear in mind that mis-typed input traits will be parsed as another discrete state.
18. Workflow: BaTS analysis To use BaTS from the command-line, type:
java �jar BaTS_beta_build2.jar [single|batch] <treefile_name> <reps> <states>
Where:
single or batch asks BaTS to analyse either a single input file, or a whole directory (batch analysis)
<treefile_name> is the name and full location of the treefile or directory to be analysed,
<reps> is the number (an integer > 1, typically 100 at least) of state randomizations to perform to yield a null distribution, and
<states> is the number of different states seen. Run example.treesRun example.trees
19.
C:\joeWork\apps\BaTS\BaTS_beta_build2\BaTS_beta_build2>java -jar BaTS_beta_build 2.jar single example.trees 100 7
Performing single analysis.
File: example.trees
Null replicates: 100
Maximum number of discrete character states: 7
analysing... 30 trees, with 7 states
analysing observed (using obs state data)
30 29
30 29
30 29
30 29
Statistic observed mean lower 95% CI upper 95% CU null mean lower 95% CI upper 95% CI significance
AI 1.5555052757263184 1.1128820180892944 2.160351037979126 12.03488540649414 11.475320040039 12.6391201928711 0.0
PS 18.5 17.0 20.0 80.7713394165039 77.86666870117188 83.56666564941406 0.0
MC (state 0) 12.633333206176758 9.0 16.0 1.7496669292449951 1.399999976158142 2.1666667461395264 0.009999990463256836
MC (state 1) 19.0 19.0 19.0 1.7480005025863647 1.33333337306976 32 2.0999999046325684 0.009999990463256836
MC (state 2) 12.666666984558105 12.0 13.0 1.77991247559 1.33333697632 2.200000047683716 0.009999990463256836
MC (state 3) 8.566666603088379 3.0 11.0 1.66733866943 1.2333333492279053 2.133333444595337 0.009999990463256836
MC (state 4) 11.0 11.0 11.0 1.5526663064956665 1.16666662693023 68 2.0999999046325684 0.009999990463256836
MC (state 5) 3.433333396911621 2.0 6.0 1.4840000867843628 1.100000023841858 2.0333333015441895 0.009999990463256836
MC (state 6) 5.066666603088379 5.0 6.0 1.2973339557647705 1.0333333015441895 1.600000023841858 0.009999990463256836
done
Done. The analysis
20. Workflow: Interpretation The null hypothesis
The null hypothesis under test is one of random phylogeny-trait association; that is, that
�No single tip bearing a given character trait is any more likely to share that trait with adjoining taxa than we would expect due to chance�
21. Workflow: Interpretation The statistics:
Larger values ? increased phylogeny-trait association
Significance indicated by p-value
In addition, observed posterior values are informative for some statistics:
PS: indicates migration events between trait values
MC(trait value): indicates number of taxon in largest clade monophyletic for that trait value
22. FAQs / common pitfalls Java 1.5 or higher is required. See java.sun.com for more.
Large datasets can be slow, so down-sample input tree files (uniformly, not randomly) where necessary, or to check BaTS input files are marked-up correctly.
A RAM (memory) shortage can slow the analysis, use �Xmx switch to allocate virtual RAM*
Check input file mark-up carefully if in doubt.
*See more: http://edocs.bea.com/wls/docs70/perform/JVMTuning.html