Download
1 / 6
60 likes | 458 Vues
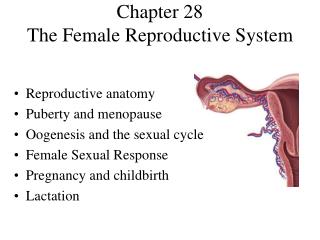
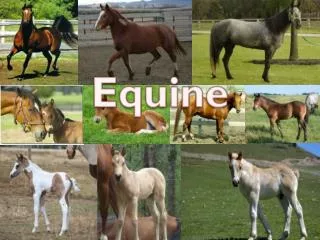
Gender Male Female 6 20 Dominant Hand Left Right 95% 5% Age Range = 18 - 35 Amount Drank 0-6 7-12 13-18 19-24 74% 26% 0% 0% Beverage of Choice Juice Soda Water Coffee Tea 13% 9% 30% 4% 22%

E N D
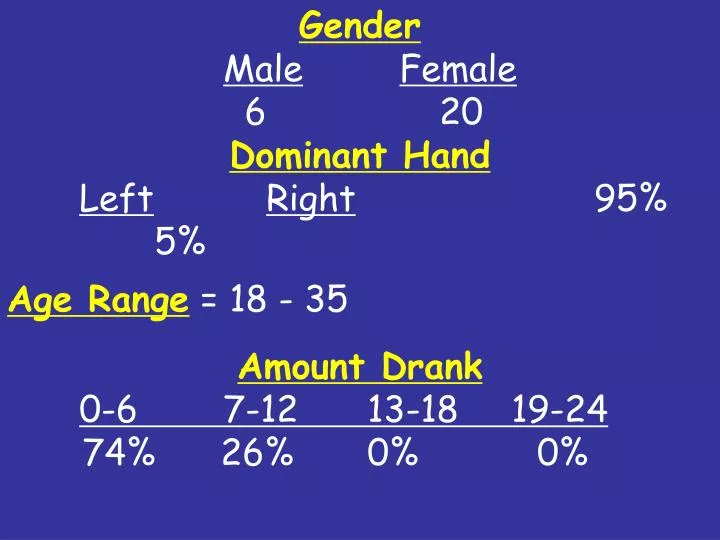
Gender MaleFemale 6 20 Dominant Hand LeftRight 95% 5% Age Range = 18 - 35 Amount Drank 0-6 7-12 13-18 19-24 74% 26% 0% 0%
Beverage of Choice JuiceSodaWaterCoffeeTea 13% 9% 30% 4% 22% LemonadeGatoradeChai Latte 4% 13% 4% Soda of Choice PepsiCokeDr. PepperSprite 48% 4% 17% 9% Mountain DewIce TeaRootbeer 9% 4% 9%
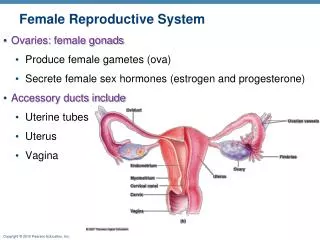
Favorite Color BrownWhiteOrangeGreenBluePink 9% 4% 4% 17% 9% 13% SilverRedPurpleBurgundyBlack 13% 9% 9% 4% 17% Least Favorite Color BeigeTealOrangeGreenBluePink 4% 4% 4% 4% 4% 9% WhiteYellowGreyRedBrown 9% 30% 4% 4% 9%
High Cost Items CostQuality 70% 30% Low Cost Items CostQuality 73% 27%
Taste Very GoodGoodAveragePoorVery Poor 35% 56% 9% 0% 0% Smell Very GoodGoodAveragePoorVery Poor 39% 39% 18% 4% 0% Ads Very HighHighAverageLowVery Low 4% 13% 39% 35% 9%
Preference PepsiRC 24 2