Download
1 / 13
130 likes | 446 Vues
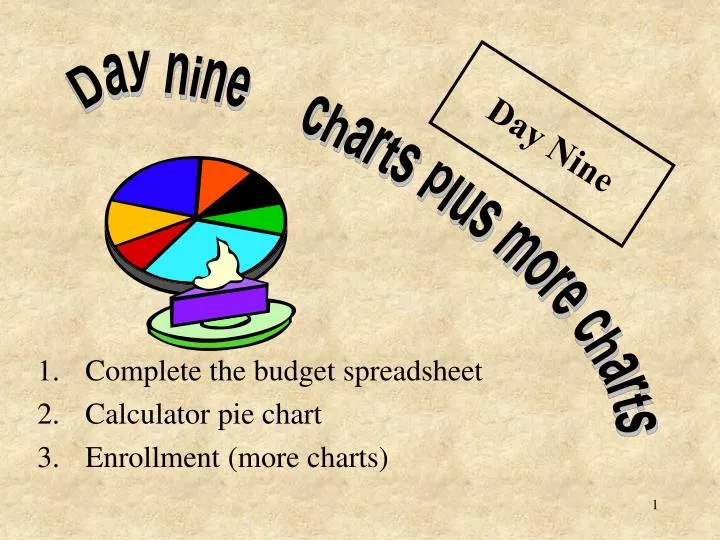
Day Nine Complete the budget spreadsheet Calculator pie chart Enrollment (more charts) Day nine charts plus more charts A Monthly Budget $36,000 annual salary Take home pay (?) Monthly expenses Food $400 Rent $700 Car payment $250 Electric + gas $250 Insurance $200

E N D
Day Nine • Complete the budget spreadsheet • Calculator pie chart • Enrollment (more charts) Day nine charts plus more charts
A Monthly Budget • $36,000 annual salary • Take home pay (?) • Monthly expenses • Food $400 • Rent $700 • Car payment $250 • Electric + gas $250 • Insurance $200 • Savings + entertainment $200 • Extra (what ever is left!) • Monthly take home and expenses • Total monthly take home pay and dollar expenses • Expenses as a percentage of monthly take home
The Task • Build a spreadsheet • Construct a bar graph • Take home • expenses • Construct a linear graph • Construct a pie chart • Expenses as a percentage of take home
Pie Chart for Budget on the Calculator Press [APPS] on calculator Use the arrows to find <CelSheet> and press [ENTER] press [ENTER] again to take you to the help screen.
Press [GRAPH] which is F5 Choose menu item 3 and type BUDGET [ENTER] [ENTER] (one enter saves the name and the other takes you to the cell sheet) In Column A enter the names of the categories: Food, Rent, Car, Ele. and gas, Ins., Sav. and Ent. You will need to press [ALPHA] [+] to access the quotation marks to put around names. In Column B enter the amount for each
Press [GRAPH] which is F5 Choose menu item 4 < Charts…> Categories: A1:A6 [ENTER] Series: B1:B6 [ENTER] Number Percent (make sure you have Number highlighted) Title: BUDGET [ENTER] DRAW [ENTER] Press [TRACE] to see what each category represents
Pie Charts and Bar Graphs: Computer and Calculator • K1 Group: the spreadsheet and charts are by K1omputer • C2 Group: the spreadsheet and charts are by C2alculator using [stat1] (lists) • C3 Group: the spreadsheet and charts are by C3alculator using [apps] <CelSheet> • Presentations: by K1, C2 , andC3