Download
1 / 1
10 likes | 437 Vues
P1.1 Climate Model Diagnoses from a Weather Modeler’s Point of View Hua-Lu Pan and Suranjana Saha Environmental Modeling Center NOAA/NWS/NCEP. Weather in the NCEP CFS model simulations and forecasts. T126.

E N D
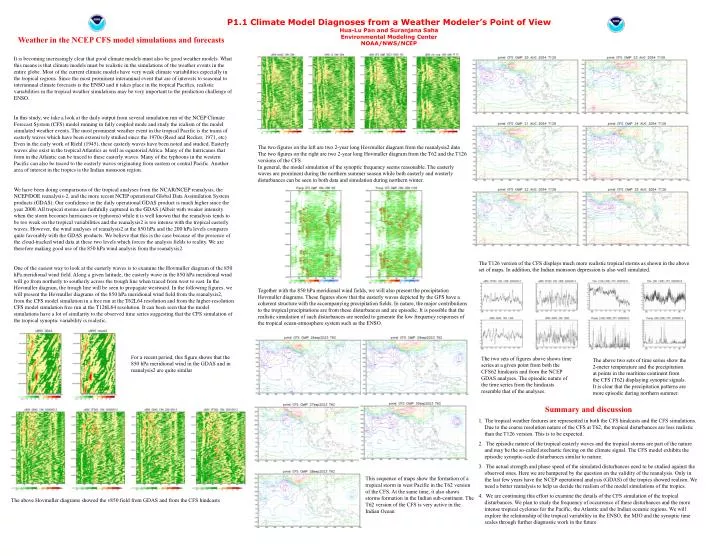
P1.1 Climate Model Diagnoses from a Weather Modeler’s Point of View Hua-Lu Pan and Suranjana Saha Environmental Modeling Center NOAA/NWS/NCEP Weather in the NCEP CFS model simulations and forecasts T126 It is becoming increasingly clear that good climate models must also be good weather models. What this means is that climate models must be realistic in the simulations of the weather events in the entire globe. Most of the current climate models have very weak climate variabilities especially in the tropical regions. Since the most prominent interannual event that are of interests to seasonal to interannual climate forecasts is the ENSO and it takes place in the tropical Pacifics, realistic variabilities in the tropical weather simulations may be very important to the prediction challenge of ENSO. In this study, we take a look at the daily output from several simulation run of the NCEP Climate Forecast System (CFS) model running in fully coupled mode and study the realism of the model simulated weather events. The most prominent weather event in the tropical Pacific is the trains of easterly waves which have been extensively studied since the 1970s (Reed and Recker, 1971, etc) Even in the early work of Riehl (1945), these easterly waves have been noted and studied. Easterly waves also exist in the tropical Atlantics as well as equatorial Africa. Many of the hurricanes that form in the Atlantic can be traced to these easterly waves. Many of the typhoons in the western Pacific can also be traced to the easterly waves originating from eastern or central Pacific. Another area of interest in the tropics is the Indian monsoon region. We have been doing comparisons of the tropical analyses from the NCAR/NCEP reanalysis, the NCEP/DOE reanalysis-2, and the more recent NCEP operational Global Data Assimilation System products (GDAS). Our confidence in the daily operational GDAS product is much higher since the year 2000. All tropical storms are faithfully captured in the GDAS (Albeit with weaker intensity when the storm becomes hurricanes or typhoons) while it is well known that the reanalysis tends to be too weak on the tropical variabilities and the reanalysis2 is too intense with the tropical easterly waves. However, the wind analyses of reanalysis2 at the 850 hPa and the 200 hPa levels compares quite favorably with the GDAS products. We believe that this is the case because of the presence of the cloud-tracked wind data at these two levels which forces the analysis fields to reality. We are therefore making good use of the 850 hPa wind analysis from the reanalysis2. One of the easiest way to look at the easterly waves is to examine the Hovmuller diagram of the 850 hPa meridional wind field. Along a given latitude, the easterly wave in the 850 hPa meridional wind will go from northerly to southerly across the trough line when traced from west to east. In the Hovmuller diagram, the trough line will be seen to propagate westward. In the following figures, we will present the Hovmuller diagrams of the 850 hPa meridional wind field from the reanalysis2, from the CFS model simulation in a free run at the T62L64 resolution and from the higher-resolution CFS model simulation free run at the T126L64 resolution. It can been seen that the model simulations have a lot of similarity to the observed time series suggesting that the CFS simulation of the tropical synoptic variability is realistic. The two figures on the left are two 2-year long Hovmuller diagram from the reanalysis2 data The two figures on the right are two 2-year long Hovmuller diagram from the T62 and the T126 versions of the CFS In general, the model simulation of the synoptic frequency seems reasonable. The easterly waves are prominent during the northern summer season while both easterly and westerly disturbances can be seen in both data and simulation during northern winter. The T126 version of the CFS displays much more realistic tropical storms as shown in the above set of maps. In addition, the Indian monsoon depression is also well simulated. Together with the 850 hPa meridional wind fields, we will also present the precipitation Hovmuller diagrams. These figures show that the easterly waves depicted by the GFS have a coherent structure with the accompanying precipitation fields. In nature, the major contributions to the tropical precipitations are from these disturbances and are episodic. It is possible that the realistic simulation of such disturbances are needed to generate the low frequency responses of the tropical ocean-atmosphere system such as the ENSO. For a recent period, this figure shows that the 850 hPa meridional wind in the GDAS and in reanalysis2 are quite similar The two sets of figures above shows time series at a given point from both the CFS62 hindcasts and from the NCEP GDAS analyses. The episodic nature of the time series from the hindcasts resemble that of the analyses. The above two sets of time series show the 2-meter temperature and the precipitation at points in the maritime continent from the CFS (T62) displaying synoptic signals. It is clear that the precipitation patterns are more episodic during northern summer. • Summary and discussion • The tropical weather features are represented in both the CFS hindcasts and the CFS simulations. Due to the coarse resolution nature of the CFS at T62, the tropical disturbances are less realistic than the T126 version. This is to be expected. • The episodic nature of the tropical easterly waves and the tropical storms are part of the nature and may be the so-called stochastic forcing on the climate signal. The CFS model exhibits the episodic synoptic-scale disturbances similar to nature. • The actual strength and phase speed of the simulated disturbances need to be studied against the observed ones. Here we are hampered by the question on the validity of the reanalysis. Only in the last few years have the NCEP operational analysis (GDAS) of the tropics showed realism. We need a better reanalysis to help us decide the realism of the model simulations of the tropics. • We are continuing this effort to examine the details of the CFS simulation of the tropical disturbances. We plan to study the frequency of occurrence of these disturbances and the more intense tropical cyclones for the Pacific, the Atlantic and the Indian oceanic regions. We will explore the relationship of the tropical variability in the ENSO, the MJO and the synoptic time scales through further diagnostic work in the future This sequence of maps show the formation of a tropical storm in west Pacific in the T62 version of the CFS. At the same time, it also shows storms formation in the Indian sub-continent. The T62 version of the CFS is very active in the Indian Ocean The above Hovmuller diagrams showed the v850 field from GDAS and from the CFS hindcasts
