Download
1 / 66
670 likes | 1.01k Vues
Urban Interface Recreation Christine Vogt, Ph.D. Michigan State University September 20, 2006 Forest Service/Clemson Short Course Topics for FS Managers………. Growing population and more diverse Housing, land use, and WUI Recreation and tourism

E N D
Urban Interface Recreation Christine Vogt, Ph.D. Michigan State University September 20, 2006 Forest Service/Clemson Short Course
Topics for FS Managers………. • Growing population and more diverse • Housing, land use, and WUI • Recreation and tourism • Midewin (IL) National Tallgrass Prairie (USDA FS) • Shiawassee (MI) Wildlife Refuge (USFW) • Hayward (WI) (Stewart et al.) • Impact exercise • Wildfire, Residents, and Recreation • San Bernardino, GMUG, Apalachicola NFs • Mark Twain NF • Issues, opportunities and problem solving
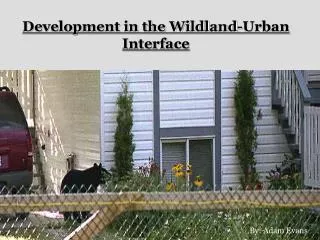
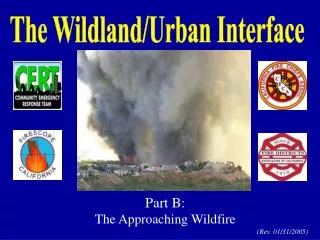
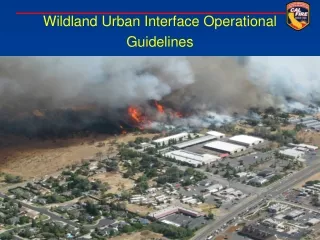
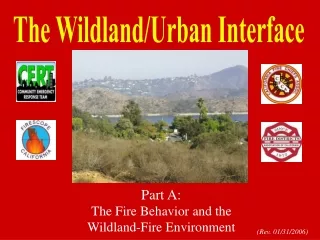
Wildland Urban Interface • Intermix + Interface = WUI • Intermix WUI are areas where housing and vegetation intermingle • Interface WUI are areas with housing in the vicinity of contiguous wildland vegetation.
Compelling Statistics on Human Effects – urbanization of rural areas (Stewart, Radeloff and Hammer) • Almost 80% of US population lives in urban areas • Urban areas have tripled since 1950 - sprawl • Housing growth has outpaced population growth for decades • WUI is 9% of lower 48 states land resources • WUI is 38% of homes • 60% of all new housing units built in the US were in the WUI • Attraction of natural resources and recreation amenities • Between 1990 and 2000, housing density in the WUI has increased (more homes in existing WUI area) • In the same 10 years, counties with national forests experienced significantly more population growth than those counties without. • Bottom line---the Forest Service has more to manage • Fire fighters have more people and property to protect • Recreation staff has more uses and more types of recreation
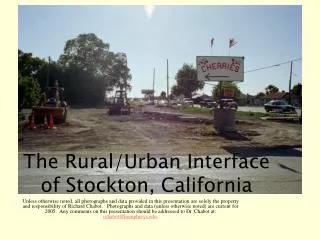
Urban Areas with lots of WUI • WUI is common on the edges of major metropolitan areas – particularly those growing in population and land use • Atlanta – intermix • San Diego and Los Angeles • Las Vegas and Reno • Phoenix and Tucson - interface • Denver - interface • Florida cities – Tallahassee, Jacksonville • WUI is also in rural areas with natural resources
Urban Connections Research by the Forest Service – Summer 2000 • Selected Boston, Detroit and Mpls. • Goal: Understand urban stakeholder’s values, viewpoints, and recreation activities • Selected findings: • NFs are personally important (95%) • NFs should be protected and preserved (99%) • NFs should be used for recreation (96%) • Majority (54%) didn’t know which agency is responsible for managing national forests • Selected FS strategies: • Further emphasize the environmental message, the FS’s good stewardship, and forest/nature images • Promote the use of forests for families and people to recreate and relax
MidewinMarket Analysis Study- 2001Prepared by C. Vogt, D. Klenosky, and K. Andereck
MidewinMarket Analysis Study- 2001Prepared by C. Vogt, D. Klenosky, and K. Andereck
Market Definition - Other nearby nature/outdoor attractions in the Chicagoland area
Transportation and Access to Midewin • What will be the primary modes of transportation used to arrive to MNTP? • Own vehicle (98% GP, 98% OI) • Organized group (13% GP, 20% OI) • Bike (1% GP, 5% OI) • Likelihood of using METRA if available? (% Definitely/Probably would use) • Moderate interest (40% GP, 30% OI)
Transportation Planning On-site • Likely use of internal transportation system (% Definitely/Probably would use) • On-site tram to gain access to different sites within MNTP (81% GP, 80% OI) • Other related info. (% Rating as Very or Extremely Important) • Attractions/facilities located within an hour’s drive from home (40% GP; 60% OI) • Attractions/facilities that are accessible via interstate highways (34% GP; 42% OI) • Attractions/facilities that are accessible via public transportation (22% GP; 19% OI)
General Pop. Visitor center (96%) Paved trails (90%) Unpaved trails (85%) Picnic areas (85%) Wildlife Viewing stations Buffalo (94%) Elk (93%) Birds (84%) Prairie plants (84%) Butterflies (81%) Outdoor Interest Group Visitor center (99%) Paved trails (88%) Unpaved trails (97%) Picnic areas (78%) Wildlife Viewing stations Buffalo (99%) Elk (99%) Birds (97%) Prairie plants (99%) Butterflies (95%) Recreation Sites and Activities(% Probably or Definitely would use)
General Pop. Wildlife (35%) Home gardening (29%) Native American history (28%) Overview of Nation’s forests/grasslands (27%) Ornithology (17%) Prairie restoration (17%) Prairie ecology (16%) Military history (15%) Farmstead/agricultural history (14%) Outdoor Interest Group Wildlife (82%) Ornithology (64%) Prairie ecology (63%) Prairie restoration (62%) Overview of Nation’s forests/grasslands (56%) Native American history (53%) Home gardening (51%) Farmstead/agricultural history (25%) Military history (19%) Program content options (% Very or Extremely Interested)
Fishing • Over half the general population (55%) showed interest in fishing areas • About one-third of the outdoor interest group (35%) showed interest in fishing areas
General Population Self-guided tours (40%) Roving naturalist/ranger (35%) Nature walks/tours (34%) Evening programs (24%) Programs at visitor center (24%) AV programs in Visitor Center (20%) Audio-cassette guided tours (17%) Outdoor Interest Group Self-guided tours (77%) Nature walks/tours (72%) Roving naturalist/ranger (60%) Programs at visitor center (52%) AV programs in Visitor Center (39%) Evening programs (36%) Audio-cassette guided tours (33%) Guided interpretative tours (% Very or Extremely Interested)
“Great Lakes Discovery Center” concept • Shiawassee National Wildlife Refuge – expansion • Friends of the refuge • Great Lakes Fisheries Trust • Bridgeport DDA and local township government • Planning groups comprised of: • Engineer/architects • Business planning • Marketing research
Purpose of the Study • The study’s purpose was to assist in shaping the facilities and offer market research for the proposed Great Lakes Discovery Center allowing for the design of an attraction that meets the travel interests of various household types.
Great Lakes Discovery Center • Location along the route I-75 and Dixie Highway • Proximity to Frankenmuth and Outlet at Birch Run • (Within 8 mile radius of tourist destinations attracting between 2.0 – 2.5 million visitors)
Detroit Zoo: Wild Adventure Simulator A concept of the nature edutainment center Sports Culture Nature Technology
Top Activities Participated in the Great Lakes region • Driving for pleasure or sightseeing 81% • Walking or hiking for pleasure 78% • Going to a museum or heritage site 59% • Going to a zoo 56% • Picnicking 55%
Most important outdoor recreation experiences/features • Enjoying fresh air 89% • Attractions/facilities that are in safe, secure environments 87% • Attractions/facilities that have comfort facilities such as clean restrooms and water fountains 85% • Attractions/facilities that are clean and well-maintained 85% • Attractions/facilities available at reasonable fees and prices 84%
Family Lifecycle Segments Existence of a child/ Age of the youngest child Age of respondents Group size (N=520) G1 Adolescence 16 - 22 No Child 6 1% G2 Early Adulthood 23 - 39 No Child 39 8% G3 Middle Adulthood 40 - 59 No Child 125 24% G4 Full Nest I 19 - 49 1 - 4 39 8% G5 Full Nest II 23 - 59 5 - 13 89 17% G6 Full Nest III 29 - 59 14 and older 75 14% G7 Late Adulthood 60 and older No Child 147 28%
Virtual Reality and Outdoor Recreation Preferences: Overall Mean Scores 3.62 Trails for hiking 3.30 Simulated hang-gliding tours 3.60 Paved trails 3.28 3D movie with glasses 3.51 Nature or interpretive trails 3.26 Demonstration habitat trails 3.46 Unpaved wood-chipped trails 3.21 3D animated narrator with movie 3.40 Unpaved dirt-surface trails 3.21 Interactive 3D 3.38 4D presentation, moving entertainment 3.20 Canoe trail on the Cass River 3.38 Simulated SCUBA diving tours 3.18 Trails for biking 3.31 Interactive educational exhibits/kiosks 3.05 3D movie without glasses Mean scale equals 1 = definitely would not use, and 5 = definitely would use.
Outdoor Recreation Facility Preferences by Family Lifecycle G1 A. G2 E.A. G3 M.A. G4 F.N.I G5 F.N.II G6 F.N.III G7 L.A. Trails for hiking (F=5.8, p=.000***) 3.5 4.3 3.6 3.9 3.8 3.7 3.2 Significant group difference: G2 > G3; G2, 4, 5 > G7 Paved trails (F=3.6, p=.002**) 3.5 4.1 3.5 3.9 3.7 3.8 3.3 Significant group difference: G2 > G7 Nature or interpretive trails (F=4.3, p=.000***) 3.7 4.0 3.5 3.7 3.7 3.6 3.1 Significant group difference: G2, 5 > G7 Unpaved wood-chipped trails (F=4.4, p=.000***) 3.8 4.2 3.3 3.5 3.6 3.6 3.2 Significant group difference: G2 > G3, 7 * p < .05; ** p < .01; and *** p < .001. Red color indicates the highest mean score on the five-point scale with “5” equaling definitely would use.
Outdoor Recreation Facility Preferences by Family Lifecycle G1 A. G2 E.A. G3 M.A. G4 F.N.I G5 F.N.II G6 F.N.III G7 L.A. Unpaved dirt-surface trails (F=7.3, p=.000***) 3.7 4.2 3.3 3.7 3.6 3.4 3.0 Significant group difference: G2 > G3, 5, 6, 7; G2, 4, 5 > G7 Demonstration habitat trails (F=4.1, p=.001**) 3.0 3.8 3.3 3.2 3.4 3.4 2.9 Significant group difference: G2, 5 > G7 Canoe trail on the Cass River (F=7.9, p=.000***) 3.5 4.1 3.1 3.3 3.5 3.4 2.7 Significant group difference: G2 > G3, 7; G2, 5, 6 > G7 Trails for biking (F=7.7, p=.000***) 3.3 3.9 3.1 3.5 3.5 3.3 2.6 Significant group difference: G2 > G3; G2, 3, 4, 5, 6 > G7 * p < .05; ** p < .01; and *** p < .001. Red color indicates the highest mean score on the five-point scale with “5” equaling definitely would use.
Virtual Reality Preferences by Family Lifecycle G1 A. G2 E.A. G3 M.A. G4 F.N.I G5 F.N.II G6 F.N.III G7 L.A. 4D presentation, moving Entertainment (F=4.3, p=.000***) 2.7 3.7 3.3 3.7 3.6 3.6 3.0 Significant group difference: G2, 5, 6 > G7 Simulated SCUBA diving tours (F=6.2, p=.000***) 3.0 3.9 3.3 3.7 3.7 3.6 2.9 Significant group difference: G2, 4, 5, 6 > G7 Interactive educational exhibits/kiosks (F=3.4, p=.003**) 2.7 3.5 3.3 3.4 3.6 3.4 3.0 Significant group difference: G5 > G7 Simulated hang-gliding tours (F=7.0, p=.000***) 2.7 3.8 3.2 3.5 3.7 3.6 2.8 Significant group difference: G2, 5, 6 > G7 * p < .05; ** p < .01; and *** p < .001. Red color indicates the highest mean score on the five-point scale with “5” equaling definitely would use.
Virtual Reality Preferences by Family Lifecycle G1 A. G2 E.A. G3 M.A. G4 F.N.I G5 F.N.II G6 F.N.III G7 L.A. 3D movie with glasses (F=3.1, p=.006**) 2.8 3.5 3.2 3.5 3.5 3.4 3.0 Significant group difference: G5 > G7 3D animated narrator with movie (F=3.5, p=.002**) 2.3 3.4 3.1 3.5 3.5 3.3 2.9 Significant group difference: G5 > G7 Interactive 3D (F=4.0, p=.001**) 2.5 3.4 3.1 3.3 3.5 3.4 2.9 Significant group difference: G5 > G7 3D Movie without glasses (F=2.7, p=.013*) 2.5 3.2 3.0 3.2 3.4 3.1 2.8 Significant group difference: G5 > G7 * p < .05; ** p < .01; and *** p < .001. Red color indicates the highest mean score on the five-point scale with “5” equaling definitely would use.
Study of WUI in Hayward, WIChequamegon-Nicolet NF Susan I. Stewart, Daniel R. Williams, Alan M. Watson, and Susan R. Van Patten Funding for this research was provided by USDA Forest Service North Central Research Station and Aldo Leopold Wilderness Research Institute, and by University of Illinois.
Life Experience Rural Mixed Urban • Current residence • Previous residences • Childhood home • Leisure and vacation experiences
A Life Course Framework of Multiple Residence Child Young Adult Adult Young-Old Older-Old Attend University Second home Visiting relatives Return migration Commuter marriage RV full-timers Telework Family second home Snowbirds, sunbirds Temporary job Visiting kids, grandkids Divorced, geographically separated parents Itinerant work Distance commuting Favorite vacation destination Knowing places over the life course through family, work, and leisure Adapted by S. Stewart from McHugh, Hogan, and Happel, 1995
Residence in the Hayward Lakes Study • Current residence (status) • Permanent or seasonal resident of Hayward Lakes area? • Previous/childhood residences (history) • Where have you lived most of your life?
Residential History Residential Status Permanent Seasonal Rural 151 47 Urban 102 152 Residential History and Status Hayward Lakes Area Study Sample
Permanent Rural Permanent Urban Seasonal Rural Seasonal Urban Age 53 60 54 57 Community Tenure (yrs) 30 12 13 14 Pct. Female 46% 35% 40% 31% Residence Group Characteristics
Attitude Measures Permanent Rural Permanent Urban Seasonal Rural Seasonal Urban Less timber harvest on private forests 4.12 4.14 3.85 4.06 Protect endangered species 4.15 4.26 4.20 4.30 Stock more fish for sportfishing 3.79 4.02 4.20 3.76 More controls on tourism development 3.70 3.68 3.80 3.68 Protect critical plant & animal habitat 3.84 3.99 4.09 4.03 More NF trails 2.64 2.73 2.65 2.82 There should be a user fee on NF’s 2.87 2.82 2.89 2.95 Restrict second home development 3.48 3.34 2.70 3.02 Game fish should be protected 3.03 2.88 2.85 2.84 Regulate water quality 4.20 4.28 4.15 4.27 Polluters should pay for clean-up 4.09 4.29 3.89 4.14 Less timber harvest on national forests 4.05 3.93 4.05 4.08 More public land for wilderness 3.21 3.90 3.22 3.72 Fewer roads into national forests 3.87 3.75 3.85 3.68 Less timber harvest on county forest 3.96 3.93 3.83 3.92 Attitudes Toward Land Management by Residence (means) Shading indicates ANOVA found significant differences. Scaled 1= strongly disagree to 5= strongly agree
Recreation Participation by Residence Status and History Activities with similar participation levels Permanent Rural Seasonal Rural Permanent Urban Seasonal Urban Chi- Square percent significance Driving for pleasure 71 60 69 68 .594 Birding 57 71 57 69 .061 Golfing 36 47 41 49 .123 Canoeing/ kayaking 29 29 43 31 .070 Picnicking 52 51 41 38 .055 Snowmobiling 22 31 28 21 .451 Mountain biking 19 11 16 25 .121 Downhill skiing 9 9 10 12 .837 Jet skiing 5 11 2 6 .125 Tennis 7 11 8 7 .809 Backpacking 3 0 1 5 .136
Recreation Participation by Residence Status and History Activities with different participation levels Permanent Rural Seasonal Rural Permanent Urban Seasonal Urban Chi- Square percent significance Fishing 68 93 65 62 .001 Gardening 73 31 79 48 .000 Camping 31 20 16 9 .000 ATV 16 22 7 8 .009 Cross-country skiing 23 16 27 34 .044 Hiking 35 31 31 47 .046 Hunting 50 38 40 22 .000 Ice fishing 47 18 22 12 .000 Motor boating 59 82 71 85 .000 Photography 50 53 40 62 .007 Water skiing 17 31 11 28 .002 Sailing 5 7 6 19 .000
Reasons for Moving Urban Rural F –stat. Signif. means Inexpensive property 2.42 1.81 11.35 .001 Retirement 3.56 2.24 31.321 .000 Outdoor recreation 3.83 3.22 8.534 .004 Cleaner environment 4.16 3.26 20.760 .000 Job opportunities 2.22 2.95 9.184 .003 Avoid problems of city 3.86 2.82 23.944 .000 More relaxed lifestyle 4.11 3.16 21.142 .000 Closer to nature 4.0 3.06 20.810 .000 Closer to family, friends 2.25 2.53 1.384 .241 Permanent residents’ reasons for moving to Hayward Lakes, by residence history Reasons were rated on 5-pt scale where 1=Not important to 5=Extremely important.
Permanent Rural Seasonal Rural Permanent Urban Seasonal Urban means Neighborhood 7.08 7.33 6.85 7.34 Hayward Lakes 6.50 6.89 6.55 6.70 Northwoods 7.04 6.84 6.93 6.94 Place Attachment by Residence Group Means represent the number out of 8 possible attachment statements respondents marked “true”.
A Changing Landscape in the Wildland-Urban Interface: Seasonal and Permanent Residents, Recreation, and Fuel Management Stan Cindrity and Dr. Christine A. Vogt Department of Park, Recreation, & Tourism Resources Michigan State University
Study Purpose • Understanding human dimension of fire and fuels reduction • Understanding the demographic shift to forested areas • Increased forest populations/residents, more recreation usage of natural resources • Retirees looking for places to live, recreate and be close to nature adsfa
Statement of Problem • Understand differences and similarities between seasonal and permanent residents on topics related to forest use and fire management in several geographic areas • Understanding the home buying decision process • Recreation usage and activities • Attitudes toward fuel treatment programs
Study Overview • Funded -USDA Forest Service, Pacific Southwest Research Station, Riverside, CA • Study sites -San Bernardino National Forest, CA -Grand Mesa, Uncompahgre and Gunnison National Forests (GMUG), CO -Apalachicola National Forest, FL • National list of communities at risk Department of Park, Recreation and Tourism Resources