Download
1 / 78
780 likes | 1.25k Vues
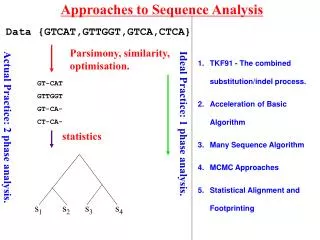
Approaches to clustering-based analysis and validation Dr. Huiru Zheng Dr. Francisco Azuaje School of Computing and Mathematics Faculty of Engineering University of Ulster Gene Expression Data Genes vs perturbations Tissues vs genes

E N D
Approaches to clustering-based analysis and validation Dr. Huiru Zheng Dr. Francisco Azuaje School of Computing and Mathematics Faculty of Engineering University of Ulster
Gene Expression Data Genes vs perturbations Tissues vs genes Expression matrices illustrating two distinct genetic profiles. genes (G), biological conditions (C), types of tissue (T).
y Cluster A Cluster B Clustering • At the end of an unsupervised recognition process (learning), we obtain a number of classes or CLUSTERS; • Each cluster groups a number of cases/input vectors; • When new input vectors are presented to the system, they are categorised into one of the existing classes or CLUSTERS x
Clustering approaches toclassification: Traditional approach a1 a2 a3 a4 a5 s1 x y z y y s2 x x x y y s3 y y x y y s4 y y y y y s5 y x x y y C1: {s3, s4} C2: {s1, s2,s5} Exclusive clusters
Clustering approaches to classification: Direct sample/attribute correlation a1 a2 a3 a4 a5 s1 x y z y y s2 x x x y y s3 y y x y y s4 y y y y y s5 y x x y y C1: {s3, s4}, {a1, a2} C2: {s1, s2,s5 }, {a4, a5} Exclusive biclusters
Clustering approaches to classification:Multiple cluster membership a1 a2 a3 a4 a5 s1 x y z y y s2 x x x y y s3 y y x y y s4 y y y y y s5 y x x y y C1: { s3, s4}, {a1, a2} C2: {s1, s2,s3,s5}, {a4, a5}
Key Algorithms • Hierarchical Clustering • K-means • Kohonen Maps • Self-adaptive methods • ……
Hierarchical Clustering(1) • Organizes the data into larger groups, which contain smaller groups, like a tree or dendrogram. • They avoid specifying how many clusters are appropriate by providing a partition for each K. The partitions are obtained from cutting the tree at different levels. • The tree can be built in two distinct ways • bottom-up: agglomerative clustering; • top-down: divisive clustering. • Algorithms: • Agglomerative (Single-linkage, complete-linkage, average-linkage) ….
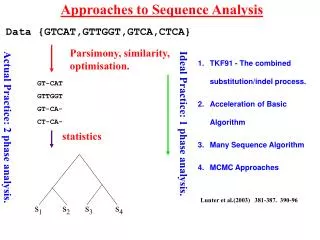
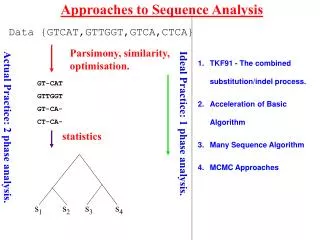
Hierarchical Clustering(2) Degrees of dissimilarity genes
Hierarchical Clustering (3) • P = set of genes • While more than one subtree in P • Pick the most similar pair i, j in P • Define a new subtree k joining i and j • Remove i and j from P and insert k
Figures of Hierarchical Clustering 1‘ 1 2 3 4 5
Figures of Hierarchical Clustering 2‘ 1 2 3 4 5
Figures of Hierarchical Clustering 2‘ 3‘ 1 2 3 4 5
Figures of Hierarchical Clustering 1 2 3 4 5
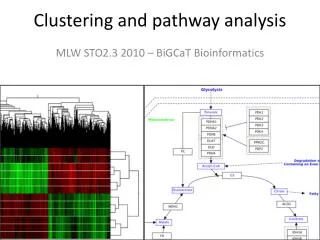
An Example of Hierarchical Clustering
Partitional clustering • To create one set of clusters that partitions the data into similar groups. • Algorithms: Forgy’s, k-means, Isodata…
K-means Clustering • A value for k is selected up front; # of expected cluster • The algorithm divides the data into k many clusters in such a way that the profiles within each cluster are more similar than those across clusters.
K-mean approach • One more input k is required. There are many variants of k-mean. • Sum-of squares criterion • minimize
An example of k-mean approach • Two passes • Begin with k clusters, each consisting of one of the first k samples. For the remaining n-k samples, find the centroid nearest it. After each sample is assigned, re-compute the centroid of the altered cluster. • For each sample, find the centroid nearest it. Put the sample in the cluster identified with this nearest centroid. ( do not need to re-compute.)
Kohonen Self-Organising Maps (SOM) • The aim of Kohonen learning is to map similar signals/input-vectors/cases to similar neurone positions; • Neurones or nodes that are physically adjacent in the network encode patterns or inputs that are similar
SOM: architecture (1) neurone i Kohonen layer wi Winning neurone Input vector X X=[x1,x2,…xn] Rn wi=[wi1,wi2,…,win] Rn
SOM: architecture (2) A rectangular grid of neurones representing a Kohonen map. Lines are used to link neighbour neurons.
SOM: architecture (3) 2-dimensional representation of random weight vectors.The lines are drawn to connect neurones which are physically adjacent.
SOM: architecture (4) 2-dimensional representation of 6 input vectors (a training data set)
SOM: architecture (5) In a well trained (ordered) network the diagram in the weight space should have the same topology as that in physical space and will reflect the properties of the training data set.
SOM: architecture (6) Input space (training data set) Weight vector representations after training
SOM-based Clustering (1) • Type of input a) The input a neural network can process is a vector of fixed length. b) This means that only numbers can be used as input and that one must setup the network in such a way that the longest input vector can be processed. This also means that to all vectors with less elements, elements must be added until they have the same size as the longest vector.
SOM-based Clustering (2) • Classification of inputs a) In a Kohonen network, each neurone is represented by a so-called weight vector; b) During training these vectors are adjusted to match the input vectors in such a way that after training each of the weight vectors represents a certain class of input vectors; c) If in the test phase a vector is presented as input, the weight vector which represents the class this input vector belongs to, is given as output, i.e. the neurone is activated.
SOM-based Clustering (3) • Learning (training) behaviour. a) During training (learning) the neurones of a Kohonen network are adjusted in such a way, that on the map there will form regions which consist of neurones with similar weight vectors. b) This means that in a well-trained map, a class will not be represented by one single neurone, but by a group of neurons. c) In this group there is one central neurone which can be said to represent the most prototypical member of this class, while the surrounding neurons represent less prototypical members.
SOM: Learning Alogorithm SOMs define a mapping from a m-dimensional input data space onto a one- or two-dimensional array of nodes; Algorithm: 1. initialize the network with n nodes; 2. select one case from the set of training cases; 3. find the node in the network that is closest (according to some measure of distance) to the selected case; 4. adjust the set of weights of the closest node and of the nodes around it; 5. repeat from 2. until some termination criterion is reached.
SOM :One single learning cycle (1) 1) The weights are initialised to random values (between the interval -0.1 to 0.1, for instance) and the neighbourhood sizes set to cover over half of the network; 2) a m-dimensional input vector Xs (scaled between -1 and +1, for instance) enters the network; 3) The distances di(Wi, Xs) between all the weight vectors on the SOM and Xs are calculated by using (for instance): where: Wi denotes the ith weight vector; wj and xj represent the jth elements of Wi and Xi respectively
SOM:One single learning cycle (2) 4) Find the best matching neurone or “winning” neurone whose weight vector Wk is closest to the current input vector Xi ; 5) Modify the weights of the winning neurone and all the neurones in the neighbourhood Nk by applying: Wjnew = Wjold + (Xi - Wjold) Where represents the learning rate; 6) Next input vectorX(i+1), the process is repeated.
SOM: Learning Parameters • If a data set consists of P input vectors or cases, then 1 learning epoch is equal to P single learning cycles • After a number of N learning epochs, the size of the neighbourhood is decreased. • After a number of M learning epochs, the learning rate, , may be decreased;
First neighbourhood Second neighbourhood SOM: Neighbourhood Schemes(1) • Linear
SOM: Neighbourhood Schemes(2) • Rectangular First neighbourhood Second neighbourhood
SOM: Neighbourhood Schemes(3) Why do we have to modify the size of neighbourhood ? • We need to induce map formation by adapting regions according to the similarity between weights and input vectors; • We need to ensure that neighbourhoods are adjacent; • Thus, a neighbourhood will represent a number of similar clusters or neurones; • By starting with a large neighbourhood we guarantee that a GLOBAL ordering takes place, otherwise there may be more than one region on the map encoding a given part of the input space.
SOM: Neighbourhood Schemes(4) • One good strategy is to gradually reduce the size of the neighbourhood for each neurone to zero over a first part of the learning phase, during the formation of the map topography; • and then continue to modify only the weight vectors of the winning neurones to pick up the fine details of the input space
SOM: Learning rate Why do we need to decrease the learning rate ? • If the learning rate is kept constant, it is possible for weight vectors to oscillate back and forth between two nearby positions; • Lowering ensures that this does not occur and the network is stable.
Visualising data and clusters with Kohonen maps U-matrix and median distance matrix maps for leukaemia data The U-matrix holds distances between neighbouring map units
Basic Criteria For The Selection Of Clustering Techniques (1) • Which clustering algorithm should I use? • Should I apply an alternative solution? • How can results be improved by using different methods?
Basic Criteria For The Selection Of Clustering Techniques (2) • There are multiple clustering techniques that can be used to analyse expression data. • Choosing “the best” algorithm for a particular problem may represent a challenging task. • Advantages and limitations may depend on factors such as the statistical nature of the data, pre-processing procedures, number of features etc. • It is not uncommon to observe inconsistent results when different clustering methods are tested on a particular data set
Basic Criteria For The Selection Of Clustering Techniques (3) • In order to make an appropriate choice, it is important to have a good understanding of: • the problem domain under study, and • the clustering options available.
Basic Criteria For The Selection Of Clustering Techniques (4) • Knowledge on the underlying biological problem may allow a scientist to choose a tool that satisfies certain requirements, such as the capacity to detect overlapping classes. • Knowledge on the mathematical properties of a clustering technique may support the selection process. • How does this algorithm represent similarity (or dissimilarity)?, • How much relevance does it assign to cluster heterogeneity?, • How does it implement the process of measuring cluster isolation?. • Answers to these questions may indicate crucial directions for the selection of an adequate clustering algorithm.
Basic Criteria For The Selection Of Clustering Techniques (5) • Empirical studies have defined several mathematical criteria ofacceptability • For example, there may be clustering algorithms that are capable of guaranteeing the generation of partitions whose cluster structures do not intersect. • Several algorithms indirectly assume that the cluster structure of the data under consideration exhibits particular characteristics. • For instance, the k-means algorithm assumes that the shape of the clusters is spherical; and single-linkage hierarchical clustering assumes that the clusters are well separated
Basic Criteria For The Selection Of Clustering Techniques (6) • Unfortunately, this type of knowledge may not always be available in an expression data study. • In this situation a solution may be to test a number of techniques on related data sets, which have previously been classified (a reference data set). • Thus, a user may choose a clustering method if it produced consistent categorisation results in relation to such reference data set.
Basic Criteria For The Selection Of Clustering Techniques (7) • Specific user requirements may also influence a selection decision. • For example, a scientist may be interested in observing direct relationships between classes and subclasses in a data partition. In this case, a hierarchical clustering approach may represent a basic solution. • But in some studies hierarchical clustering results could be difficult to visualise because of the number of samples and features involved. Thus, for instance, a SOM may be considered to guide an exploratory analysis of the data.
Basic Criteria For The Selection Of Clustering Techniques (8) • In general the application of two or more clustering techniques may provide the basis for the synthesis of accurate and reliable results. • A scientist may be more confident about the clustering experiments if very similar results are obtained by using different techniques.