Download
1 / 32
320 likes | 687 Vues
BIO318: Statistics Workshop A brief primer on the use of statistics in the study of animal behaviour Outline What is Statistics? Why do we use Statistics? Some “simple” guidelines Overview of the assignment Useful resources Questions What is Statistics?

E N D
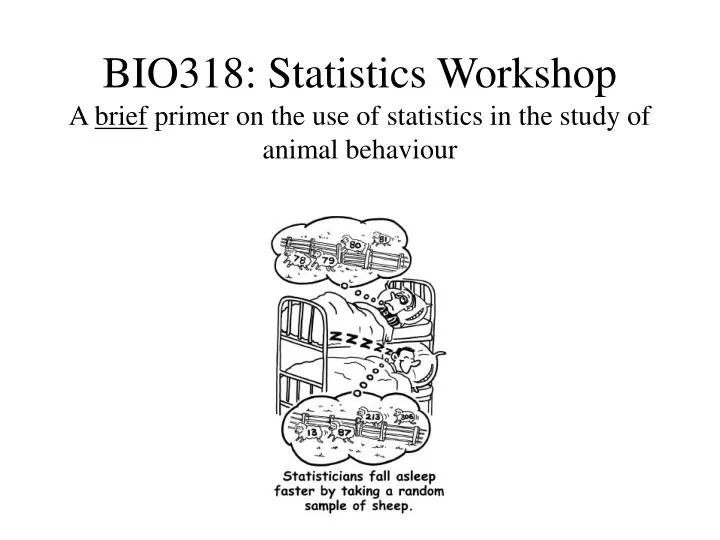
BIO318: Statistics WorkshopA brief primer on the use of statistics in the study of animal behaviour
Outline • What is Statistics? • Why do we use Statistics? • Some “simple” guidelines • Overview of the assignment • Useful resources • Questions
What is Statistics? • “A branch of applied mathematics concerned with the collection and interpretation of quantitative [numerical] data” http://wordnet.princeton.edu/
“Simple” Guidelines • What is your question? Your hypothesis? • Describe the structure of your data • Graph your raw data • Decide what statistical test to employ • Is your data parametric or not? • Find an appropriate resource to carry out statistical test • Interpret the results of statistical test • Write-up the results and display the summary statistics
“Simple” Guidelines • What is your question? Your hypothesis? • Describe the structure of your data • Graph your raw data • Decide what statistical test to employ • Is your data parametric or not? • Find an appropriate resource to carry out statistical test • Interpret the results of statistical test • Write-up the results and display the summary statistics
1. Cricket Aggression Experiment • Question: • What is the effect of female presence on male-male aggression in the house cricket, Acheta domesticus? • Hypothesis: • Female presence affects the aggressive behaviours of male crickets. • Prediction: • During aggressive contests, pairs of males in the presence of a female will behave differently than pairs of males on their own.
“Simple” Guidelines • What is your question? Your hypothesis? • Describe the structure of your data • Graph your raw data • Decide what statistical test to employ • Is your data parametric or not? • Find an appropriate resource to carry out statistical test • Interpret the results of statistical test • Write-up the results and display the summary statistics
2. Cricket Aggression Raw Data:Aggressive Song Duration (s) Independent Variable? Dependent Variable? # of IVs? Type of IV? Type of DV?
“Simple” Guidelines • What is your question? Your hypothesis? • Describe the structure of your data • Graph your raw data • Decide what statistical test to employ • Is your data parametric or not? • Find an appropriate resource to carry out statistical test • Interpret the results of statistical test • Write-up the results and display the summary statistics
3. Graph your raw data Song Duration (s) Without Fem. With Fem. Treatment • Check for data entry mistakes • Helps you decide on the proper statistical test
3. Graph your raw data Song Duration (s) Without Fem. With Fem. Treatment • Check for data entry mistakes • Helps you decide on the proper statistical test
3. Graph your raw data Song Duration (s) Without Fem. With Fem. Treatment • Check for data entry mistakes • Confirms how you thought your data was organized
3. Graph your raw data Song Duration (s) Without Fem. With Fem. Treatment
3. Graph your raw data Song Duration (s) Without Fem. With Fem. Treatment
3. Graph your raw data Song Duration (s) Without Fem. With Fem. Treatment
3. Graph your raw data Song Duration (s) Without Fem. With Fem. Treatment
3. Graph your raw data Song Duration (s) Without Fem. With Fem. Treatment
“Simple” Guidelines • What is your question? Your hypothesis? • Describe the structure of your data • Graph your raw data • Decide what statistical test to employ • Is your data parametric or not? • Find an appropriate resource to carry out statistical test • Interpret the results of statistical test • Write-up the results and display the summary statistics
“Simple” Guidelines • What is your question? Your hypothesis? • Describe the structure of your data • Graph your raw data • Decide what statistical test to employ • Is your data parametric or not? • Find an appropriate resource to carry out statistical test • Interpret the results of statistical test • Write-up the results and display the summary statistics
With Female Without Female 4b. Assessing Parametric AssumptionsFrequency Histograms
4b. Assessing Parametric AssumptionsBoxplots Song Duration (s) Without Fem. With Fem. Treatment
“Simple” Guidelines • What is your question? Your hypothesis? • Describe the structure of your data • Graph your raw data • Decide what statistical test to employ • Is your data parametric or not? • Find an appropriate resource to carry out statistical test • Interpret the results of statistical test • Write-up the results and display the summary statistics
5. Pick Your Analysis Program • On-line tools • Statistics software
“Simple” Guidelines • What is your question? Your hypothesis? • Describe the structure of your data • Graph your raw data • Decide what statistical test to employ • Is your data parametric or not? • Find an appropriate resource to carry out statistical test • Decipher the output of statistical test • Write-up the results and display the summary statistics
6. Deciphering the Output • Null Hypothesis (H0): • No difference between two categories of IV • Alternative Hypothesis (Ha): • Categories of IV differ from one another If p < 0.05, then reject H0 (i.e. H0 is false, therefore Ha must be true) If p > 0.05, then do not reject H0 (i.e. results inconclusive)
“Simple” Guidelines • What is your question? Your hypothesis? • Describe the structure of your data • Graph your raw data • Decide what statistical test to employ • Is your data parametric or not? • Find an appropriate resource to carry out statistical test • Decipher the output of statistical test • Write-up the results and display the summary statistics
Song Duration (s) Without Fem. With Fem. Treatment 7. Summarize Data Results: • clear, concise, objective • do not interpret data • indicate the direction of effect, if any • give test statistics, sample sizes, p-values Figure 1: Give a descriptive caption.
Statistics Assignment • analyze the six different aggressive behaviours • make sure to use the appropriate parametric or nonparametric test • write a results section • construct figures to display results