Download
1 / 41
580 likes | 1.57k Vues
Environmental Life Cycle Assessment. An LCA Introduction and an investigation of Biodiesel LCAs Joyce Smith Cooper Mechanical Engineering University of Washington cooperjs@u.washington.edu. Defining the Product Life Cycle. Other life cycles. recovery. Product use, maintenance, upgrade.

E N D
Environmental Life Cycle Assessment An LCA Introduction and an investigation of Biodiesel LCAs Joyce Smith Cooper Mechanical Engineering University of Washington cooperjs@u.washington.edu
Defining the Product Life Cycle Other life cycles recovery Product use, maintenance, upgrade Material extraction Material processing Product manufacturing disposal Assessment Questions: Why? What? Who? Where? How? When? With what environmental implications? At what cost? What opportunities exist for partnerships, elimination of toxics, material recovery, …..?
A coffee maker’s life cycle From Pré Consultants, "The Eco-indicator99: A damage oriented method for Life Cycle Impact Assessment, Manual for Designers," http://www.pre.nl/eco-indicator99/index.html
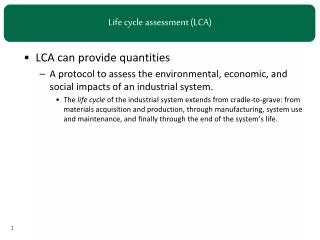
Life Cycle Assessment LCA is a technique for assessing the environmental aspects and potential impacts associated with a product by: • compiling an inventory of relevant inputs and outputs of a product system • evaluating the potential environmental impacts associated with those inputs and outputs • interpreting the results of the inventory and impact analyses in relation to the objective of the study. • Direct Applications • Product development and improvement • Strategic planning • Public policy making • Marketing Goal and Scope Definition Inventory Assessment Interpretation Impact Assessment From ISO14040-1997, Environmental management-- Life cycle assessment-- Principles and framework
Goal and Scope of the study • The goal of a LCA describes • the intended application (what is being assessed?), • the reasons for carrying out the study, • the intended audience (to whom the results of the study are intended to be communicated) • The scope of the LCA considers • System function • Included materials and processes • Type of impact assessment From ISO14040-1997, Environmental management-- Life cycle assessment-- Principles and framework
Different ways to provide the same function • Hold coffee • Plastic cup, polystyrene cup, ceramic cup, china cup, thermos, … • Maintain a tidy haircut • Plastic comb, metal comb, razor … • Mowing your lawn • Power mower, reel mower, a goat … • Protecting a surface from corrosion • Painting, anodizing, make from plastic …. From Wenzel, H., M. Hauschild, L. Alting, 2000, Environmental Assessment of Products: volume 1: Methodology, tools, and case studies in product development, Chapman Hall Publishers, New York.
Functional Unit • ISO14040-1997: “a measure of the performance of the functional outputs of the product system” • Includes: • A magnitude • A duration • A level of quality
System Boundaries • ISO14040-1997: • What materials/ equipment will be included • How will this be determined • What phases of the life cycle will be included • The reality • often by material weight (% of product) • facilities, equipment, and infrastructure are often neglected
The Life Cycle Inventory • Create a process flow diagram/ mass balance for the life cycle. • Identify • The product flows between unit processes • Material and energy use and waste that comes from or goes to the environment
The Unit Process For each unit process, identify inputs, outputs, and recovery as follows: Closed Loop Reuse/ Recycle Outputs Product Co-Products= open loop reuse/ recycle Waste (fugitive or to treatment: air, water, solid) Inputs Raw or Intermediate Materials Energy Unit Process
Process Data Sources • Measurements • LCI databases: USDatabase Project, Boustead, SimaPro, GaBi, DEAM, BUWAL, APME (plastics data) • Literature data: • LCA reports • Engineering References: Encyclopedia of Chemical Technology, Kirk-Othmer, Ulman, etc. • Journal and conference papers • National laboratory research reports • Emission factors (AP-42, etc.) • EPA sector notebooks • Computation/ Parametric Models (for example, GREET)
“Gasoline combustion in industrial equipment” • Data from the US Database Project at www.nrel.gov/lci/ • user name of lci@lci.org and a password of lci
“Electricity Production” • Data from the US Database Project at www.nrel.gov/lci/ • user name of lci@lci.org and a password of lci
Impact Assessment • Impact assessment looks at how inventory flows (cause) contribute to impacts (effect) • Impact assessment can include • Classification • inventory flows are placed in impact categories • Characterization • the contribution of each inventory flow is estimated for each impact of interest • Normalization • the contribution of the product to each impact at the global, national, regional, or local level is assessed • Valuation/ Weighting • subjective preferences are used to prioritize impact categories and impacts
Impact Assessment • Classification • Inventory materials are categorized as: • Abundant or rare, • Hazards, • Regulated materials, • Recyclable materials, • Materials that contribute to global warming, acidification….
Classification by Material Abundance • Materials can be classified as those in • infinite supply: Ar, Br, Ca, Cl, Kr, Mg, N, Na, Ne, O, Rn, Si, Xe • ample supply: Al (Ga), C, Fe, H, K, S, Ti • adequate supply: I, Li, P, Rb, Sr • potentially limited supply: Co, Cr, Mo(Rh), Hi, Pb (As, Bi), Pt (Ir, Os, Pb Rh, Ru), Zr (Hf) • potentially highly limited supply: Ag, Au, Cu (Se, Te), He, Hg, Sn, Zn, (Cd, Ge, In, Tl) (lists by-product metals in parentheses after their reservoir parent) From Graedel, T., B. Allenby, Design for Environment, Prentice Hall (1996)
Classification • Qualitative process of categorizing inventory flows
Classification • Acidification • Eutrophication
-(CF2)4CH(OH)- (CF3)2CFOCH3 (CF3)2CHOCH3 (CF3)2CHOCHF2 (CF3)2CHOH (CF3)CH2OH C2F6 CARBON DIOXIDE CARBON TETRAFLUORIDE C-C3F6 C-C4F8 CF3 CF2CH2OH CH3OCH3 FIC-1311 HCFE-235DA2 HFC-125 HFC-134 HFC-134A HFC-143 HFC-143A HFC-152 HFC-152A HFE-338MCF2 HFE-347MCC3 HFE-347-MCF2 HFE-356MCF3 HFE-356MEC3 HFE-356PCC3 HFE-356PCF2 HFE-356PCF3 HFE-374PCF2 HFE-7100 HFE-7200 HG-01 HG-10 H-GALDEN 1040X METHANE NF3 NITROUS OXIDE PERFLUOROBUTANE PERFLUOROHEXANE PERFLUOROPENTANE PERFLUOROPROPANE SF5CF3 SF6 Classification: Global Warming • HFC-161 • HFC-227EA • HFC-23 • HFC-236CB • HFC-236EA • HFC-236FA • HFC-245CA • HFC-245FA • HFC-32 • HFC-365MFC • HFC-41 • HFC-4310MEE • HFE-125 • HFE-134 • HFE-143A • HFE-227EA • HFE-236EA2 • HFE-236FA • HFE-245CB2 • HFE-245FA1 • HFE-245FA2 • HFE-254CB2 • HFE-263FB2 • HFE-329MCC2
1,1,1,2-TETRACHLOROETHANE 1,1,2,2-TETRACHLOROETHANE 1,1,2-TRICHLOROETHANE 1,1-DICHLOROETHANE 1,1-DICHLOROETHYLENE 1,1-DIMETHYLHYDRAZINE 1,2,3,4,6,7,8-HEPTACHLORODIBENZOFURAN 1,2-DIBROMOETHANE 1,2-DICHLOROETHANE 1,2-DICHLOROPROPANE 1,3-BUTADIENE 1,3-DICHLOROBENZENE 1,3-DICHLOROPROPENE 1,4-DICHLOROBENZENE 1,4-DIOXANE 11,12-BENZOFLUORANTHENE 1-CHLORO-2,3-EPOXYPROPANE 1-CHLORO-4-NITROBENZENE 1-NAPHTYL N-METHYLCARBAMATE 2,3,4,7,8-PENTACHLORODIBENZOFURAN 1,2-DIBROMOETHANE 1,2-DICHLOROETHANE 1,2-DICHLOROPROPANE 1,3-BUTADIENE 1,3-DICHLOROBENZENE 1,3-DICHLOROPROPENE 1,4-DICHLOROBENZENE 1,4-DIOXANE 11,12-BENZOFLUORANTHENE 1-CHLORO-2,3-EPOXYPROPANE 1-CHLORO-4-NITROBENZENE 1-NAPHTYL N-METHYLCARBAMATE 2,3,4,7,8-PENTACHLORODIBENZOFURAN 2,3,7,8-TCDD 2,3,7,8-TETRACHLORODIBENZOFURAN 2,4,6-TRICHLOROPHENOL 2,4,6-TRINITROTOLUENE 2,4-D [ACETIC ACID (2,4-DICHLOROPHENOXY)-] 2,4-DIAMINOTOLUENE 2,4-DINITROTOLUENE 2,6-DINITROTOLUENE etc Classification: Carcinogens
Characterization • Characterization is the quantification of the contribution of each inventory flow to each impact of interest • Whereas inventory analysis can be seen as a model which includes all types of complications (cut-off, multifunctionality, etc.) characterization uses the results of complicated models: • Fate and transport • Exposure assessment • Dose-response • Etc.
Characterization • Computational structure where hi= the contribution of the product system to impact i qij= the equivalency (or characterization) factor for intervention j for impact i gj= components of the inventory vector for intervention j (remember g=Bs)
Global Warming Potentials as Equivalency Factors • Process X emits 5 kg methane and 4 kg nitrous oxide • gCH4 = 5 kg, gN2O = 4 kg • The equivalency factors are the 100-year Global Warming Potentials (GWPs): • qglobal warming-CH4 = GWPCH4 = 21 g CO2/ g CH4 • qglobal warming-N2O = GWPN2O = 310 g CO2/ g N2O • THEREFORE the potential contribution to global warming for methane is • qglobal warming-CH4 x gCH4 = 5,000 g x 21 g CO2/ g CH4=105,000 g CO2 • AND the total contribution of Process X to global warming is: • hglobal warming= (105,000 + 1,240,000) g CO2 = 1,345 kg CO2
Impact Assessment • Characterization • Inventory materials are weighted by their contribution to different impacts • Normalization • Characterization results are compared to important levels of impacts (at the national level, for the technology being replaced, etc.) • Valuation • Impacts are weighted by their value to decision makers
Biodiesel LCAs • Biodiesel • is a renewable diesel fuel substitute. • can be made from a variety of natural oils and fats. • Biodiesel is made by chemically combining any natural oil or fat with an alcohol such as methanol or ethanol. Methanol has been the most commonly used alcohol in the commercial production of biodiesel. • In Europe, biodiesel is widely available in both its neat form (100% biodiesel, also known as B100) and in blends with petroleum diesel. European biodiesel is made predominantly from rapeseed oil (a cousin of canola oil). • In the United States, initial interest in producing and using biodiesel has focused on the use of soybean oil as the primary feedstock mainly because the United States is the largest producer of soybean oil in the world. From Sheehan, et al. (1998) “Life Cycle Inventory of Biodiesel and Petroleum Diesel for Use in an Urban Bus,” NREL/SR-580-24089 UC Category 1503
Why LCA of Biodiesel? • Proponents of biodiesel as a substitute for diesel fuel (in blends or in its neat form) can point to a number of potential advantages for biodiesel that could support a number of strategies for addressing national issues: • Reducing dependence on foreign petroleum… • Leveraging limited supplies of fossil fuels…. • Mitigating greenhouse gas emissions…. • Reducing Air Pollution and Related Public Health Risks…. • Benefiting our domestic economy…. From Sheehan, et al. (1998) “Life Cycle Inventory of Biodiesel and Petroleum Diesel for Use in an Urban Bus,” NREL/SR-580-24089 UC Category 1503
Biodiesel Synthesis Pathways From Holbein, et al. (2004) “Canadian Biodiesel Initiative: Aligning Research Needs and Priorities With the Emerging Industry,” Prepared for Natural Resources Canada
Biodiesel LCAs • Several biodiesel LCAs have been performed (US, Canada, Germany…) • The foremost US study was a LCI funded by the USDOE and US Department of Agriculture: Sheehan, et al. (1998) “Life Cycle Inventory of Biodiesel and Petroleum Diesel for Use in an Urban Bus,” at http://www.nrel.gov/docs/legosti/fy98/24089.pdf
The US Biodiesel LCA • Reductions in Petroleum and Fossil Energy Consumption • Substituting 100% biodiesel (B100) for petroleum diesel in buses reduces the life cycle consumption of petroleum by 95%. • This benefit is proportionate with the blend level of biodiesel used. When a 20% blend of biodiesel and petroleum diesel (B20) is used as a substitute for petroleum diesel in urban buses, the life cycle consumption of petroleum drops 19%. • It was found that the production processes for biodiesel and petroleum diesel are almost identical in their efficiency of converting a raw energy source (in this case, petroleum and soybean oil) into a fuel product. The difference between these two fuels is in the ability of biodiesel to utilize a renewable energy source. • Biodiesel yields 3.2 units of fuel product energy for every unit of fossil energy consumed in its life cycle. The production of B20 yields 0.98 units of fuel product energy for every unit of fossil energy consumed. • By contrast, petroleum diesel’s life cycle yields only 0.83 units of fuel product energy per unit of fossil energy consumed. Such measures confirm the “renewable” nature of biodiesel. From Sheehan, et al. (1998) “Life Cycle Inventory of Biodiesel and Petroleum Diesel for Use in an Urban Bus,” NREL/SR-580-24089 UC Category 1503
The US Biodiesel LCA • Reductions in CO2 Emissions • Given the low demand for fossil energy associated with biodiesel, it is not surprising that biodiesel’s life cycle emissions of CO2 are substantially lower than those of petroleum diesel. • Biodiesel reduces net emissions of CO2 by 78.45% compared to petroleum diesel. For B20, CO2 emissions from urban buses drop 15.66%. • In addition, biodiesel provides modest reductions in total methane emissions, compared to petroleum diesel. Methane is another, even more potent, greenhouse gas. Thus, use of biodiesel to displace petroleum diesel in urban buses is an extremely effective strategy for reducing CO2 emissions. From Sheehan, et al. (1998) “Life Cycle Inventory of Biodiesel and Petroleum Diesel for Use in an Urban Bus,” NREL/SR-580-24089 UC Category 1503
The US Biodiesel LCA • Changes in Air Pollutant Emissions • The effect of biodiesel on air quality is more complex. Biodiesel, as it is available today, offers substantial improvements in some air pollutants, while it leads to increases in others. • The use of B100 in urban buses results in substantial reductions in life cycle emissions of total particulate matter, carbon monoxide and sulfur oxides (32%, 35% and 8% reductions, respectively, relative to petroleum diesel’s life cycle). From Sheehan, et al. (1998) “Life Cycle Inventory of Biodiesel and Petroleum Diesel for Use in an Urban Bus,” NREL/SR-580-24089 UC Category 1503
The US Biodiesel LCA • Particulates, Carbon Monoxide and Sulfur Oxides... • are targeted by EPA because of the important role they play in public health risks, especially in urban areas where the acute effects of these pollutants may be greater. • Given the concern over urban air quality, it is important to note that most of these reductions occur because of lower emissions at the tailpipe. For buses operating in urban areas, this translates to an even greater potential benefit: • Tailpipe emissions of particulates less than 10 microns in size are 68% lower for buses run on biodiesel (compared to petroleum diesel). In addition, tailpipe emissions of carbon monoxide are 46% lower for buses run on biodiesel (compared to petroleum diesel). Biodiesel completely eliminates emissions of sulfur oxides at the tailpipe. • The reductions in air emissions reported here are proportional to the amount of biodiesel present in the fuel. Thus, for B20, users can expect to see 20% of the reductions reported for biodiesel used in its neat form (B100). From Sheehan, et al. (1998) “Life Cycle Inventory of Biodiesel and Petroleum Diesel for Use in an Urban Bus,” NREL/SR-580-24089 UC Category 1503
The US Biodiesel LCA • Increased Emissions of Nitrogen Oxides (NOx)… • NOx is one of three pollutants implicated in the formation of ground level ozone and smog in urban areas (NOx, CO and hydrocarbons). • The use of B100 in urban buses increases life cycle emissions of NOx by 13.35%. Blending biodiesel with petroleum proportionately lowers NOx emission. B20 exhibits a 2.67% increase in life cycle emissions of NOx. • Most of this increase is directly attributable to increases in tailpipe emissions of NOx. B100, for example, increases tailpipe levels of NOx by 8.89%. From Sheehan, et al. (1998) “Life Cycle Inventory of Biodiesel and Petroleum Diesel for Use in an Urban Bus,” NREL/SR-580-24089 UC Category 1503
The US Biodiesel LCA • Hydrocarbons—higher on a life cycle basis, but lower at the tailpipe… • The increase in hydrocarbon emissions is due to release of hexane in the processing of soybeans and volatilization of agrochemicals applied on the farm. • Total life cycle emissions of hydrocarbons are 35% higher for B100, compared to petroleum diesel. However, emissions of hydrocarbons at the tailpipe are actually 37% lower. • These results point out opportunities for improving the life cycle of biodiesel. Future biodiesel research should focus on ways of reducing hexane releases from today’s current levels in soybean crushing plants. • Improvements in use of agrochemicals on the farm would have similarly beneficial effects. From Sheehan, et al. (1998) “Life Cycle Inventory of Biodiesel and Petroleum Diesel for Use in an Urban Bus,” NREL/SR-580-24089 UC Category 1503
The UK Biodiesel LCA: with Impact Assessment • A UK-based LCA included impact assessment considering two types of biodiesel production. One where the biodiesel is produced using more conventional means and one where it is produced : • Using low nitrogen methods of cultivation • With the rapeseed straw as an alternative heating fuel for the drying, solvent extraction, refining and esterification process. • With biodiesel as the fuel for agricultural machinery and transportation. • Among the 2, conventional production is considered a conservative representation as follows. From Mortimer, et al. (2003) “EVALUATION OF THE COMPARATIVE ENERGY, GLOBAL WARMING AND SOCIO-ECONOMIC COSTS AND BENEFITS OF BIODIESEL,” Prepared for the Department for Environment, Food and Rural Affairs
A UK Biodiesel LCIA: Carbon Dioxide and GHG Emissions • Biodiesel is described as ‘carbon neutral’ such that any CO2 emissions associated with it comes from a source outside that of combustion of the fuel. • In fact there are many sources of CO2 associated with biodiesel production. Most of the emissions come from the esterification process, the production of fertilizer and the extraction of the oil from the seed. • These CO2 emissions are not always produced directly from the process but taken from the energy requirement. What this means is that the energy a process uses has an associated emission. For example electricity used in the esterification process may well come from a coal power plant, so the amount of electricity used can be related to the amount of CO2 released from the plant. • It was found that for every ton of biodiesel produced 916 ± 52 kg CO2 was released into the atmosphere. • This dominates the greenhouse gas emissions: for each ton of biodiesel produced the equivalent of 1,516 ± 88 kg of CO2 are released. From http://www.esru.strath.ac.uk/EandE/Web_sites/02-03/biofuels/why_lca.htm and Mortimer, et al. (2003) “EVALUATION OF THE COMPARATIVE ENERGY, GLOBAL WARMING AND SOCIO-ECONOMIC COSTS AND BENEFITS OF BIODIESEL,” Prepared for the Department for Environment, Food and Rural Affairs
A UK Biodiesel LCIA: Carbon Dioxide Emissions From http://www.esru.strath.ac.uk/EandE/Web_sites/02-03/biofuels/why_lca.htm and Mortimer, et al. (2003) “EVALUATION OF THE COMPARATIVE ENERGY, GLOBAL WARMING AND SOCIO-ECONOMIC COSTS AND BENEFITS OF BIODIESEL,” Prepared for the Department for Environment, Food and Rural Affairs
For every ton of biodiesel produced 16,269 ± 896 MJ of energy is required. • By quantifying the amount of energy required to produce biodiesel it is possible not only to see what processes require the most energy but also to establish an energy balance over the life cycle. I.e. the energy you get out against the energy you put in. From http://www.esru.strath.ac.uk/EandE/Web_sites/02-03/biofuels/why_lca.htm and Mortimer, et al. (2003) “EVALUATION OF THE COMPARATIVE ENERGY, GLOBAL WARMING AND SOCIO-ECONOMIC COSTS AND BENEFITS OF BIODIESEL,” Prepared for the Department for Environment, Food and Rural Affairs
A UK Biodiesel LCIA: What does it mean? • Not surprisingly the largest energy demands match up with the CO2 emissions. • A ton of biodiesel will contain around 40,800MJ of energy. Energy Balance = Energy OUT / Energy IN = 40,800 / 16.269 = 2.5 • For these number to mean anything however there has to be something against which to compare them. In the case of biodiesel this would be the LCA of fossil diesel. From http://www.esru.strath.ac.uk/EandE/Web_sites/02-03/biofuels/why_lca.htm and Mortimer, et al. (2003) “EVALUATION OF THE COMPARATIVE ENERGY, GLOBAL WARMING AND SOCIO-ECONOMIC COSTS AND BENEFITS OF BIODIESEL,” Prepared for the Department for Environment, Food and Rural Affairs
A UK Biodiesel LCIA: Bio- vs. Fossil- Diesel • CO2 Emissions • For each MJ of biodiesel produced 0.025Kg of CO2 is released. • For each MJ of fossil diesel produced 0.087Kg of CO2 is released. • GHG Emissions • For each MJ of biodiesel produced 0.041Kg of GHG CO2 equivalent is released. • For each MJ of fossil diesel produced 0.095Kg of GHG CO2 equivalent is released. • Energy Requirements • For each MJ of biodiesel produced 0.45 MJ is required. • For each MJ of fossil diesel produced 1.26 MJ is required. From http://www.esru.strath.ac.uk/EandE/Web_sites/02-03/biofuels/why_lca.htm and Mortimer, et al. (2003) “EVALUATION OF THE COMPARATIVE ENERGY, GLOBAL WARMING AND SOCIO-ECONOMIC COSTS AND BENEFITS OF BIODIESEL,” Prepared for the Department for Environment, Food and Rural Affairs