Download
1 / 11
110 likes | 132 Vues
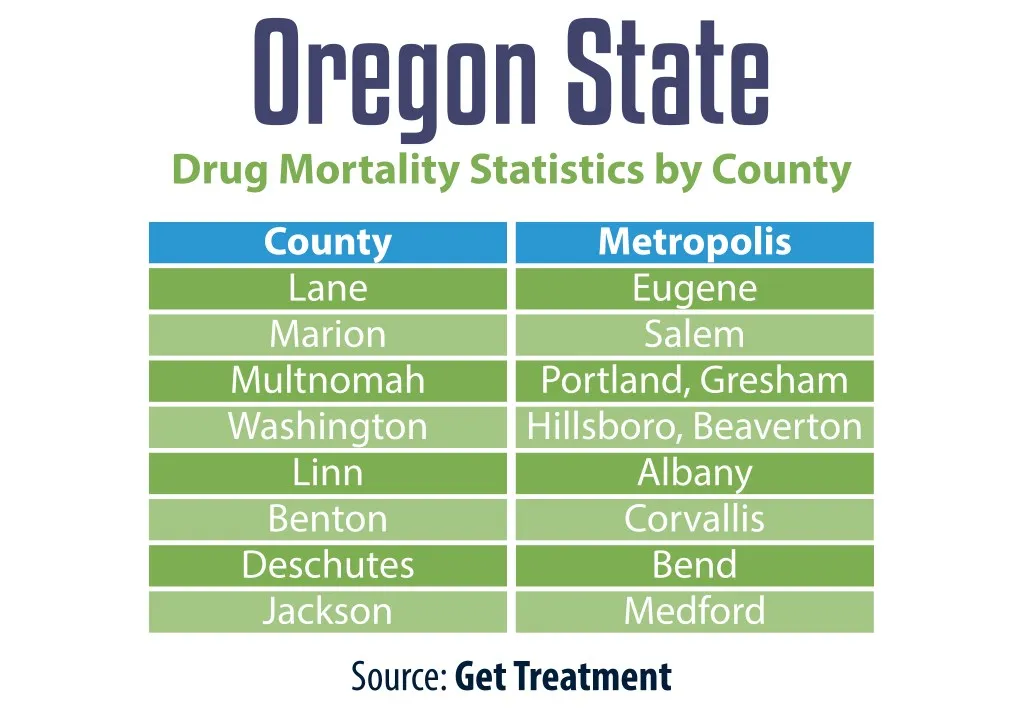
See the statistics of the Oregon State Drug Mortality by County. https://gettreatment.com/find-treatment-by-state/oregon-drug-and-alcohol-treatment-centers

E N D
Oregon State Drug Mortality Statistics by County County Lane Marion Multnomah Washington Linn Benton Deschutes Jackson Metropolis Eugene Salem Portland, Gresham Hillsboro, Beaverton Albany Corvallis Bend Medford Source: Get Treatment
Drug Poisoning Mortality in Lane County (855) 638-9268 Age-adjusted Death Rate / 100,000 people 22 20 18 16 14 12 10 8 1998 2000 2002 2004 2006 2008 2010 2012 2014 2016 Sources: CDC, Get Treatment
Drug Poisoning Mortality in Marion County (855) 638-9268 Age-adjusted Death Rate / 100,000 people 14 13 12 11 10 9 8 7 6 5 4 1998 2000 2002 2004 2006 2008 2010 2012 2014 2016 Sources: CDC, Get Treatment
Drug Poisoning Mortality in Multnomah County (855) 638-9268 24 Age-adjusted Death Rate / 100,000 people 22 20 18 16 14 12 10 8 1999 2000 2001 2002 2003 2004 2005 2006 2007 2008 2009 2010 2011 2012 2013 2014 2015 Sources: CDC, Get Treatment
Drug Poisoning Mortality in Multnomah County (855) 638-9268 24 Age-adjusted Death Rate / 100,000 people 22 20 18 16 14 12 10 8 1999 2000 2001 2002 2003 2004 2005 2006 2007 2008 2009 2010 2011 2012 2013 2014 2015 Sources: CDC, Get Treatment
Drug Poisoning Mortality in Washington County (855) 638-9268 Age-adjusted Death Rate / 100,000 people 12 11 10 9 8 7 6 5 4 1998 2000 2002 2004 2006 2008 2010 2012 2014 2016 Sources: CDC, Get Treatment
Drug Poisoning Mortality in Washington County (855) 638-9268 Age-adjusted Death Rate / 100,000 people 12 11 10 9 8 7 6 5 4 1998 2000 2002 2004 2006 2008 2010 2012 2014 2016 Sources: CDC, Get Treatment
Drug Poisoning Mortality in Linn County (855) 638-9268 Age-adjusted Death Rate / 100,000 people 18 16 14 12 10 8 6 1999 2000 2001 2002 2003 2004 2005 2006 2007 2008 2009 2010 2011 2012 2013 2014 2015 Sources: CDC, Get Treatment
Drug Poisoning Mortality in Benton County (855) 638-9268 Age-adjusted Death Rate / 100,000 people 10 9 8 7 6 5 4 3 2 1998 2000 2002 2004 2006 2008 2010 2012 2014 2016 Sources: CDC, Get Treatment
Deschutes County Substance Abuse Mortality 14 Age Adjusted Death Rate / 100,000 People 13 12 11 10 9 8 7 6 5 4 1999 2000 2001 2002 2003 2004 2005 2006 2007 2008 2009 2010 2011 2012 2013 2014 2015 855-638-9268 Sources: CDC, Get Treatment
Jackson County Substance Abuse Mortality Age-adjusted Death Rate / 100,000 people (855) 638-9268 20 18 16 14 12 10 8 6 1999 2000 2001 2002 2003 2004 2005 2006 2007 2008 2009 2010 2011 2012 2013 2014 2015 Sources: CDC, Get Treatment