Download
1 / 6
60 likes | 69 Vues
Crossroad Elf DSS Pvt Ltd (Crossroad Elf) is a fast growing IT Services Company headquartered in Bangalore, India. The companyu2019s core competency includes Data Analytics, Data Engineering, Decision Science Systems. We provide turnkey solutions to customers who are keen on succeeding and achieving sustainable growth in the modern day business scenario. We bring together design, technology, and innovation, to provide solutions tailored to suit customer needs. In the process, we create unique experiences and key moments of interaction with a focus on the clientu2019s end goals u2013 profit and growth. For more contact 91 - 6360516334 or Visit our Website : http://www.crossroadelf.com/

E N D
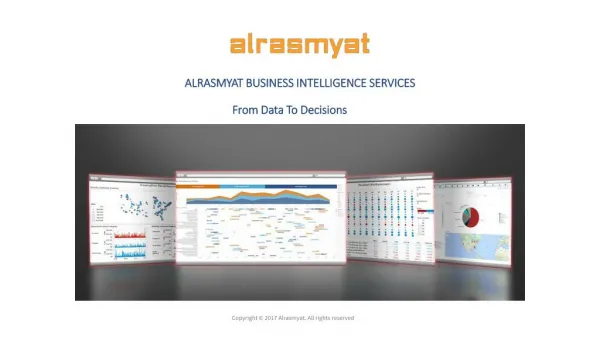
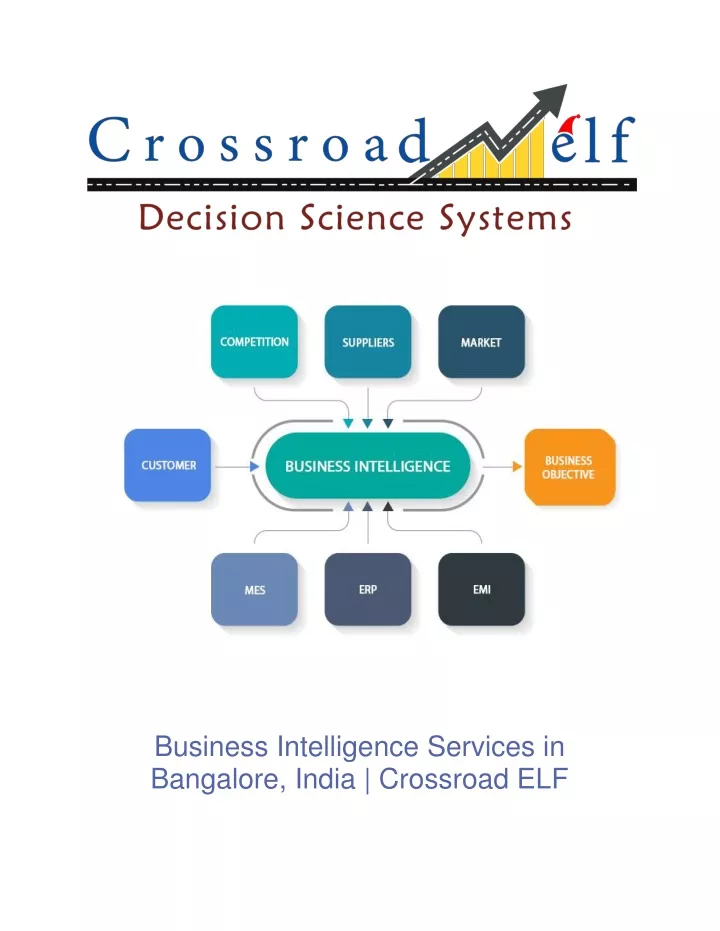
Business Intelligence Services in Bangalore, India | Crossroad ELF
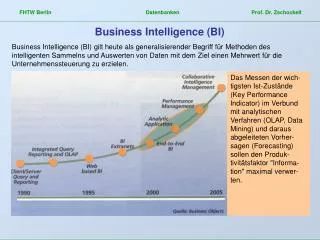
Business Intelligence The team of experts at our company is equipped with the skills required to deliver the best in class Business Intelligence solutions based on your specific business needs. Business Intelligence (BI) is a set of tools supporting the transformation of raw data into useful information which can support decision making. Business Intelligence provides reporting functionality, tools for identifying data clusters, support for data mining techniques, business performance management and predictive analysis. The aim of Business Intelligence is to support decision making. In fact, BI tools are often called Decision Support Systems (DSS) or fact-based support systems as they provide business users with tools to analyze their data and extract information. Business Intelligence tools often source the data from data warehouses. The reason is straight forward: a data warehouse already has data from various production systems within an enterprise; the data is cleansed, consolidated, confirmed and stored in one location. Because of this BI tools are able to concentrate on analyzing the data. Techniques Used in BI Data visualization is the graphical and visual representation of data. Different visual elements like charts, graphs and maps, provide an accessible way to see and understand trends, outliers and patterns in data. Data visualizations turn datasets into visuals that are much easier for the human brain to understand and process. In order to craft good data visualization, start with clean data that is well sourced and complete. Once your data is ready to visualize, pick the right chart then design and customize your visualization. Data Mining Data mining is a computer supported method to reveal previously unknown or unnoticed relations among data entities. Data mining techniques are used in a myriad of ways: shopping basket analysis, measurement of products consumers buy together in order to promote other products; in the banking sector, client risk assessment is used to evaluate whether the client is likely to pay back the loan based on historical data; in the insurance sector, fraud detection based on behavioral and historical data; in medicine and health, analysis of complications and/or common diseases may help to reduce the risk of cross infections.
Reporting Design, schedule and generation of the performance, sales, reconciliation and savings reports is an area where BI tools help business users. Reports output by BI tools efficiently gathers and present information to support the management, planning and decision-making process. Once the report is designed it can be automatically sent to a predefined distribution list in the required form presenting daily/weekly/monthly statistics. Time-series Analysis Including (Predictive Techniques) Nearly all data warehouses and all enterprise data have a time dimension. For example, product sales, phone calls, patient hospitalizations, etc. It is extremely important to reveal the changes in user behavior in time, the relation between products, or changes in sale contracts based on marketing promotion. Based on the historical data, we may also endeavor to predict future trends or outcomes. On-line Analytical Processing (OLAP) OLAP is best known for the OLAP-cubes which provide a visualization of multidimensional data. OLAP cubes display dimensions on the cube edges (e.g. time, product, customer type, customer age etc.). The values in the cube represent the measured facts (e.g. value of contracts, the number of sold products etc.). The user can navigate through OLAP cubes using drill-up, drill-down and drill-across features. The drill up functionality enables the user to easily zoom out to more coarse-grained details. Conversely, drill-down displays the information with more details. Finally, drilling-across means that the user can navigate to another OLAP cube to see the relations on another dimension(s). All the functionality is provided in real-time. Statistical Analysis Statistical analysis uses the mathematic foundations to qualify the significance and reliability of the observed relations. The most interesting features are distribution analysis, confidence intervals (for example for changes in user behaviors, etc.). Statistical analysis is used for devising and analyzing the results from data mining. Balanced scorecards & Executive dashboard In order for present day businesses to be successful efficient internal processes, good customer relations, long-term strategic investments in employees and technologies are needed. “In 1992, Robert S. Kaplan and David Norton introduced the Balanced Scorecard, a method intended to give managers a fast, comprehensive view of the performance of a business.”
The Balanced Scorecard is made up of four key elements. These elements are defined as: Financials Financial indicators will vary from organization to organization but they are based on the expectancy of the organization’s strategic objective. Customer Identifies Customers, Markets, Value Proposition and Satisfaction Examples: Market Share, Retention, New Customers, Satisfaction Indexes, Customers Profitability, Product/Service Attributes Internal Perspectives Internal Perspectives is the critical processes necessary for delivery of superior performance in achieving financial measures Examples: Project Performance, Reflections/Reworks, Cycle Times, Success Rates Learn And Growth Identity and Resources of the Organizational Framework Examples: Staff Performance, Employee Satisfaction, Training Out of the box (Package BI) Implementations If you are looking for a quick and easy implementation of BI solution for a specific business function or for an enterprise-wide BI implementation, you can opt in for packaged BI Implementation. There are many Out of the box BI packages available in the market. However, we specialize in Oracle BI Apps specifically the Finance module.
Oracle Business Intelligence Applications (OBIA or BI Apps) is a packaged BI solution for use with Oracle source systems such as EBS, JD Edwards, Siebel and PeopleSoft. It uses OBIEE as a reporting platform and until recently, Informatica/ODI as the ETL tool. Now, Oracle also provides BI Apps versions that use Oracle Data Integrator as the ELT tool. In either case, data from Oracle source systems is loaded into the Oracle Business Applications Warehouse (OBAW) using prebuilt Informatica / ODI metadata. Users then access prebuilt dashboards and subject areas in OBIEE that use the OBAW as a source. OBIA is modular and an individual Application is used to describe all of the Informatica / ODI and OBIEE metadata used for a particular functional area such as Financial Analytics or Sales Analytics. OBIA can be customized to reflect customizations in Oracle source systems or to introduce entirely new reporting functionality including new transactional sources. Popular Business Intelligence Tools
Crossroad Elf is based in HSR Layout, Bangalore and is one among the top data engineering companies in India. We pioneer in providing high quality services in the following domains: Data Migration, Data Engineering, Data Analytics, Data Science. Our Engineers are highly qualified and experienced in Informtica, Power BI reporting, Tableau, ETL, OLAP, Cloud data engineering, Data Migration, Data Modeling, OBIA Consulting, OBIEE Consulting and so on. For more details visit our Website : http://www.crossroadelf.com/ Contact No. : +91 - 6360516334 : +91 - 7899757299