Download
1 / 38
380 likes | 716 Vues
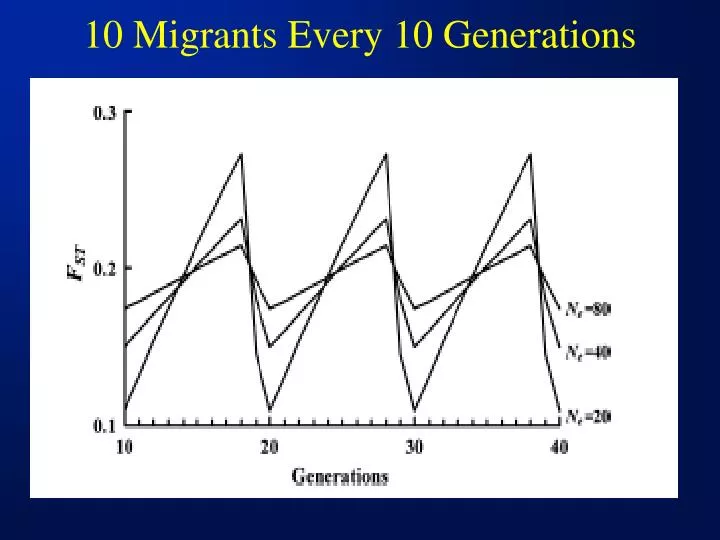
10 Migrants Every 10 Generations. Some Points/Issues from Last Slide.

E N D
Some Points/Issues from Last Slide • The interval between migrations has an effect on Fst – Fst will increase with time as a result of genetic drift following a migration event,until the next migration event when it will drop (although it has no effect on the average Fst over the long term) • The smaller the Ne of subpops and/or the larger the interval between migrations, the wilder the ocillation • Migration rate should be kept as constant as possible – especially in small populations where Fst can increase rapidly over a short time span without migration
What is Inbreeding? When the parents of an individual share one or more common ancestors, the individual is inbred Inbred matings include self-fertilization, mating of brother-sister, father-daughter, mother-son, etc. Also known as “consanguineous breeding”
Inbreeding • The consequences of matings between relatives is that offspring have an increased probability of inheriting alleles that are recent copies of the same DNA sequence. • Recent copies of the same allele are referred to as identical by descent or autozygous - Differs from homozygosity in that not all homozygous alleles are identical by descent – can be allozygous (Adh copies 7 and 8 differ at 9 bases but are homozygous for Adh-F)
Two ways that identical alleles can be sampled A1A2 A3A4 A5A6 A7A8 Generation t - 1 A7 A1 A5 A2 A1 A4 A8 Gene Pool A3 A6 A6 A5 A8 A7 A4 A2 A3 Generation t A6A6 A3A7 A4A6 A1A5 Probability 1/2N alleles identical 1- 1/2N alleles distinct X Ft-1 inbreeding in previous generation
Taken together the probability of creating a zygote in generation t with both alleles identical by descent (Ft) is: Ft = 1/2Ne + [1- 1/2Ne] Ft-1 Inbreeding coefficient in generation t Inbreeding coefficient in generation t-1 Effective population size
A calculation with and without prior inbreeding Ft = 1/4 + [1-1/4] 0 = 0.250 Ft = 1/4 + [1-1/4] .25 = 0.437
We can also predict accumulated inbreeding over several generations when the initial population is inbred 1- Ft = [1- 1/(2Ne)]t (1-Fo) 1-Ft = [1-(1/8)]10 (1- 0.25) 1-Ft = (0.263) (0.75) = 0.197 Ft= 0.803
And when the initial population is not inbred Ft = 1- [1 – 1/(2Ne)]t Ft = 1- [1 – (1/8)]10 Ft = 1- 0.263 = 0.737
Conservation Concerns with Inbreeding 1. Inbreeding coefficient increases rapidly in small closed populations Generation 0 F=0 Generation 1 F=1- (1-1/2N)1 = 1- (1-1/8)1 = 0.125 Generation 2 F=1- (1-1/2N)2 = 1- (1-1/8)2 = 0.234 Generation 4 F=1- (1-1/2N)4 = 1- (1-1/8)4 = 0.410 Generation 10 F=1- (1-1/2N)10= 1- (1-1/8)10=0.737
Conservation Concerns with Inbreeding 2. Inbreeding also accumulates with time at a rate dependent upon their population sizes. Inbreeding increases more rapidly in small than large populations 1.0 N=5 N=25 F 0.5 N=100 0 N=500 0 10 20 30 40 50 Generations (t) F (N=5) after 50 gen = 1.00 F (N=500) after 50 gen = 0.049
Conservation Concerns with Inbreeding 3. Inbreeding is unavoidable in small populations as all individuals become related by descent over time 0.3 1200 Average F 0.2 800 N F 0.1 400 N 0 0 Przewalski’s Horse 1910 1930 1950 1970 1990 (Mongolian Wild Horse) Year
Conservation Concerns with Inbreeding 4. Inbreeding reduces reproductive fitness – known since the time of Darwin (1876) Characters # Sp. # Exp. O>I O<I Similar Difference (O-I) Height 54 83 57 8 18 13% Weight 8 11 8 1 2 Flowering 32 58 44 9 5 Seed Set 23 33 26 2 5 41%
Conservation Concerns with Inbreeding Inbreeding reduces reproductive fitness in essentially all well-studied populations of outbreeding plants and animals and is known as inbreeding depression .. 1.0 . .. … Outbred Mortality ….. Ralls and Ballou (1983) Inbreeding depression for 41 of 44 captive mammal pops with a 33% reduction in juvenile survival 0.5 …. .. 0 0 0.5 1.0 Inbred Mortality
Inbreeding depression in the wild • There is now irrefutable evidence despite earlier skepticism • Crnokrak and Roff (1999 Heredity) reviewed 35 papers on inbreeding depression in nature for 34 taxa that included 157 data sets. In 141 cases (90%) inbred individuals did poorer than outbreds
Linearity of inbreeding depression with F Inbreeding depression in Maize Height 1 Mean Inbred Outbred .6 Yield .2 0 .2 .4 .6 .8 1.0 F
Inbreeding depression is greater in more stressful conditions A. Selfing Rose Pink Plant Relative Fitness (Dudash 1990) .45 .25 B. Outcross Relative Fitness .99 .95 Field Green house
Variation in inbreeding – different loci will become homozygous in different individuals Peromyscus polionotus 3 subsp. 8 Litter Mass 7.5 7 0 0.2 0.4 0.6 F F
Effects of Ploidy on Inbreeding Depression • Absent in haploids as there are no hidden deleterious alleles • Expect less inbreeding depression in tetraploids than diploids for similar degrees of inbreeding – true for plant Epilobium angustifolium, inbreeding depression due to selfing was 0.95 in diploids and 0.68 in tetraploids (Husband and Schemske 1997)
Inbreeding and Extinction: A Threshold EffectFrankham (1995)
Detecting and Measuring Inbreeding Depression Comparing survival of inbred and outbred offspring in the wild (Jimenez et al. 1994; white-footed mice) 1 Survival Inbred Outbred 0.5 0 0 4 8 12 Weeks after Introduction
An alternative approach for detecting inbreeding depression • To outcross populations suspected of suffering inbreeding depression • If the outcrossed progeny display increased fitness (heterosis) then the original population is suffering inbreeding depression
Inbreeding depression, environmental stress, and population size variation in scarlet gilia (Ipomopsis aggregata)Heschel and Paige (1995)
Small Small Large N=61 N=42 N=2435
An alternative approach for detecting inbreeding depression • Use genetic markers to infer the degree of inbreeding, comparing inbreds and outbreds • Comparison of allozyme heterozygoisties from 25 loci of Isle Royale gray wolves to Mainland wolves indicates inbreeding & possible inbreeding depression • F = 1- (0.039/0.087) = 0.55
An alternative approach for detecting inbreeding depression • In Heschel and Paige 1995 RAPD markers demonstrated a significantly higher percentage of band sharing within two of the small populations than two of the large populations • 62.3 + 1.23% & 66.3 + 1.65% versus 53.6 + 1.76% & 49.1 + 3.54%
Natural Selection should often favor matings between individuals of intermediate genetic similarity - Matings between very similar individuals may lead to inbreeding depression (deleterious recessive alleles are exposed) - Matings between very dissimilar individuals may disrupt favorable gene complexes and lead to outbreeding depression
Hybridization between different local populations can sometimes destroy locally adapted gene complexes - Tatra Mountain Ibex - Capra ibex ibex - Nubian Ibex - Capra ibex nubiana - Bezoars - Capra ibex aegagrus - Fremont and Narrowleaf Cottonwood Trees - Populus angustifolia, P. fremontii
Price and Waser (1979) showed that outbreeding depression will often occur on a much finer scale than previously recognized, especially in plants subject to restricted pollen and seed dispersal
Such plants are likely to show pronounced microgeographic genetic differentiation resulting from drift in subpopulations isolated by distance or from adaptation to local edaphic and biotic conditions
Optimal Outcrossing Optimal Outcrossing Repro. Success Inbreeding Depression Outbreeding Depression Genetic Dissimilarity
Delphinium nelsoni b bc bc c Seeds/ Flower a Selfed 1 10 100 1000 Outcrossing Distance (M)
Optimal Outcrossing in Agave schottii - Field and Genetic StudiesTrame et al. (1995)
b ab ab Relative Fitness a 1 M 10M 100M 2500M Outcrossing Distance
a ab b Proportion Bands Shared b 1M 10M 100M 2500M Outcrossing Distance