Download
1 / 42
450 likes | 1.16k Vues
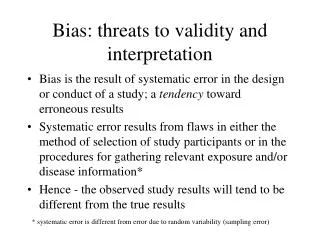
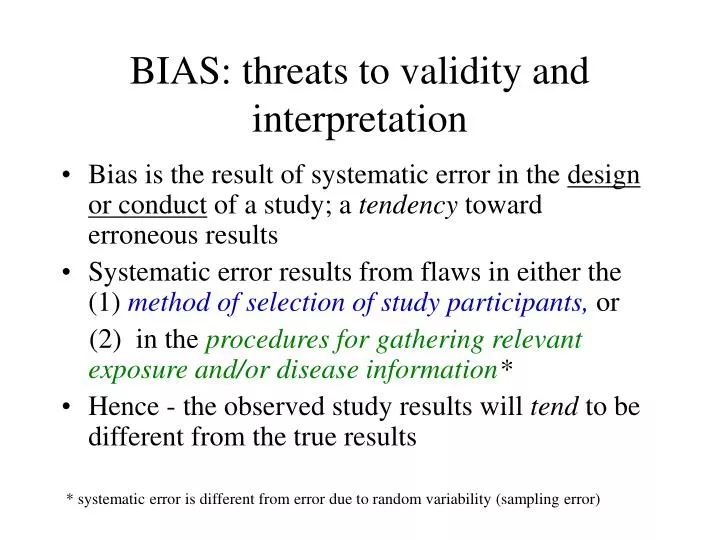
BIAS: threats to validity and interpretation. Bias is the result of systematic error in the design or conduct of a study; a tendency toward erroneous results Systematic error results from flaws in either the (1) method of selection of study participants, or

E N D
BIAS: threats to validity and interpretation • Bias is the result of systematic error in the design or conduct of a study; a tendency toward erroneous results • Systematic error results from flaws in either the (1) method of selection of study participants, or (2) in the procedures for gathering relevant exposure and/or disease information* • Hence - the observed study results will tend to be different from the true results * systematic error is different from error due to random variability (sampling error)
Main points to be covered • What is selection bias? • in a case-control study • in a cohort study • in a clinical trial • Avoiding and detecting selection bias • What is information bias? • Examples of information bias: • recall bias, • interviewer or observer bias, • surveillance bias, • Differential and non-differential misclassification • How to prevent or minimize information bias • Information bias in a case-control study (recall bias)
Selection bias • Selection Bias: is present when individuals have different probabilities of being included in the study according to relevant study characteristics: namely the exposure and the outcome of interest • Selection bias anytime there is systematic error in the selection of study subjects – cases or controls in a case-control study, exposed or unexposed in a cohort study
REFERENCE POPULATION Diseased + - + - Exposed STUDY SAMPLE Figure 4.2
Example of bias in a case-control study:Coffee and cancer of the pancreas; MacMahon et al; (N Eng J Med 1981; 304:630-3) Cases: patients with histologic diagnoses of cancer of the exocrine pancreas who were in any of 11 large hospitals in the Boston metropolitan area and Rhode Island between October 1974 and August 1979 Controls: Other patients who were under the care of the same physician in the same hospital at the time of an interview with a patient with pancreatic cancer. Patients with diseases known to be associated with smoking or alcohol consumption were excluded: with diseases of the pancreas or hepatobiliary tract*, cardiovascular disease,diabetes mellitus, respiratory or bladder cancer, and peptic ulcer. “Patients with gastroenterologic conditions were probably overepresented in relation to a general hospital population” Describe the cases - What study base gave rise to these CASES? What would be a good population to get controls from?
Coffee and cancer of the pancreas; MacMahon et al, (N Eng J Med 1981; 304:630-3) Males Case Control 482 41 Coffee No coffee 216 307 OR= 2.7 (1.2-6.5)
Selection bias: case-control studies • In case-control studies, selection bias may arise if the cases and controls do not represent all the individuals in the population being studied, ie. the study base. • Selection bias is particularly likely when dealing with a secondary study base; ie. when the cases are defined first. • In the previous case, the lower odds of exposure (coffee intake) in controls led to a spurious positive association between coffee intake and pancreatic cancer.
Coffee and pancreatic cancer: chapter 2; Hsieh et al, (N Eng J Med 1986; 315: 587-588) All Case Control Coffee No coffee 370 70 170 270 OR= 1.5 (0.8-2.6)
Selection bias: cohort studies • In cohort studies, the most common form of selection bias occurs with loss to follow up. • When those lost to follow-up are more or less likely to include exposed and affected individuals - differential loss to follow-up: probability of the outcome is different in those who remain in cohort vs. those who leave (due to refusal, migration, jail, ...) • Eg: In a study following adolescents at risk for HIV, those who sell drugs may be more likely to be incarcerated. If selling drugs is associated with a more needle sharing, a biased association would result for needle sharing and HIV incidence.
Selection bias: cohort studies • Selection bias is less likely to occur in cohort studies (compared to case-control) since study participants (exposed or unexposed) are selected (theoretically) before the disease occurs • Selection bias can occur on the “front-end” of the cohort if diseased individuals are mistakenly entered into the cohort • Eg: In a study of physically active men a positive association was found for exercise exposure and all-cause mortality. If study participants were enrolled who had undiagnosed cardiovascular disease were more likely to exercise less, what would the effect be on the measure of association?
Selection bias: cohort studies • Results obtained from studies comparing survival among HIV infected IDU and homosexual men were not consistent. One study showed that progression rates in cohorts of IDU were slower than those in cohorts of homosexual men after adjusting for for potential confounders such as age at seroconversion. (Multicohort analysis Project Workshop. Part 1. AIDS 1994, 8:911-921). Others found no such difference. • A subsequent study found that IDU had a high “pre-AIDS” mortality rate: “.. “...In contrast, pre-AIDS mortality was much higher in IDU than homosexual men...” “ ...Withdrawal differed between the two risk groups. Therefore the inclusion or exclusion of losses to follow-up and pre-AIDS deaths in the denominator altered results. … Pre-AIDs mortality may not be independent of progression and non-progression”. (Prins et al, 1997, AIDS 1997, 11:621-631). • Prins et al, further showed that: “…pre-AIDS death from natural causes was found to be related with ongoing time since HIV seroconversion and immunosuppression” (Prins et al, AIDS 1997, 11:1747-1756).
Selection bias: clinical trial • The potential for selection bias in clinical trials is in losses to follow-up • Consider - a drug that causes a symptomatic side effect that frequently results in discontinuation of the study medication or drop-out. • What would happen if you discontinued following them? • What will the effect be on the study findings if the side effect is associated with the main outcome?
Example of possible bias due to losses to follow-up in a clinical: Chestnut CH et al, A randomized trial of nasal spray salmon calcitonin in postmenopausal women with established osteioporosis: the PROOF study. Am J. Med 2000; 109:267-276. Purpose: a 5-year, double-blind, randomized, placebo-controlled study to determine whether salmon calcitonin (SC) nasal spray reduced the risk of vertebral fractures. Subjects and methods: 1,255 post-menopausal women with established osteoporosis were randomly assigned to receive the SC nasal spray. Vertebral fracture assessed with lateral radiographs. Primary efficacy endpoint was the risk of new vertebral fractures in the 200 IU SC nasal spray group compared to placebo group. Results: During 5 years, 1,108 participants had at least one follow-up radiograph. A total of 783 women completed 2 years of treatment, and 511 completed 5 years. The 200 IU SC nasal spray dose significantly reduced the risk of new vertebral fractures by 33% compared with placebo [200 IU: 51 of 287, placebo: 70 of 270, RR=0.67, 95% CI, 0.47-0.97, p=0.03]. In the 817 women with one to five prevalent vertebral fractures at enrollment, the risk was reduced by 36% (RR-0.64, 95% CI0.43-0.96, p=0.03)… Conclusion: SC nasal spray at a dose of 200 IU daily significantly reduces the risk of new vertebral fractures in postmenopausal women with osteoporosis.
Results: 59% of participants withdrew from the study prematurely. Rates of discontinuation were similar in all dosage groups. Cummings & Chapurlat: What PROOF proves about calcitonin and clinical trials (Editorial). Am J Med 2000; 109:330-331. There was a 36% reduction in risk of vertebral deformities in the group that received 20- IU a day, but no significant effects were seen with a higher dose. There wa not consistent reduction in the risk of other types of fractures across doses. “The authors state that women who were lost from the placebo group were similar in the most easily measurable respects to those who were lost form the calcitonin groups. When so many participants fail to finish a trial, , however, readers rightly wonder whether this really retains the valididy of a “randomized” trial. The authors used an “intention to treat” analysis…But the participants who were lost were not followed up, and the investigators have not information about the treatments of outcomes of more than half the women who were originally enrolled” It was not known if fractures had occurred in these participants. Because the overall number of fractures was small, even a few fractures in the participants lost to follow-up could have altered findings of the trial.
Avoiding and detecting selection bias • In case-control studies, Choose controls from the same “study-base” as cases. • In cohort studies, the rate of loss to follow-up indicates the potential for selection bias. Comparison of the characteristics of those lost to follow-up with those persons remaining under follow-up, may indicate the potential consequences of any selection bias.
Information Bias • Information Bias: results from a systematic error in measurement thus leading to misclassification (in exposure or outcome category). • A classic example is: recall bias, in which the ability to recall past exposure is dependent on case or control status. Cases may be more likely than controls to overstate past exposure
Misclassification of EXPOSURE REFERENCE POPULATION Diseased The direction of the association is a function of which cell(s) are subjected to a higher or lower probability + - + - Exposed Cases Control Eg...unexposed cases in this example tend to mistakenly report past exposure to a greater extent than do controls STUDY SAMPLE
Misclassification of OUTCOME REFERENCE POPULATION Diseased + - + - Exposed Cases Control Eg…cases in this are mistakenly classified as controls due to low sensitivity on a screening test STUDY SAMPLE
Information Bias • These errors result in misclassification of exposure and/or outcome status • Terms: validity, sensitivity, specificity and reliability refer to classification of both disease and exposure status(and confounders)
Definition of Terms Related to Classification • Validity: the extent to which a measurement measures what it purports to measure. • Sensitivity: the ability of a test to identify correctly those who have the disease (or characteristic) of interest. • Specificity: the ability of a test to identify correctly those who do not have the disease (or characteristic) of interest • Reliability (repeatability): the extent to which the results obtained by a test are replicated in the test is repeated.
1. Exposure Identification Bias • Problems in the collection of exposure data • 2 main examples: • Recall bias • Interviewer bias
1.1 Recall Bias • Most cited: inaccurate recall of past exposure (may be due to temporality, social desirability or diagnosis). • If recall differs between cases and controls, misclassification is differential; • If the error is of similar magnitude, then it is said to be non-differential • Example: study of association between hair color and tanning ability and melanoma* • *Weinstock et al (Recall (report) bias and reliability in the retrospective assessment of melanoma risk; AJE 1991; 133:240-245.
How to Prevent Recall Bias • Verification of exposure information from participants by review of pre-existing records • Objective markers of exposure or susceptibility (for example- genetic markers). • A disadvantage of some biologic markers is that they assess current, rather than past exposure. Eg. Cotinine as a marker of cigarette smoking. • Nested case-control studies allow evaluation of exposures prior to “case” status
1.2 Interviewer Bias • May occur when interviewers are not blinded to disease status. • They may probe more • Interviewers may be biased toward the study hypothesis (or have other biases). • They may ignore protocols • Prevent or assess with reliability/validity substudies; (phantom studies) • eg. Doll and Hill study of lung cancer and smoking
2. Outcome Identification Bias • May occur in both case-control or cohort studies • Problems in the collection of outcome measurements. • Two main examples: • Observer bias • Respondent bias
2.1 Observer Bias • In a Cohort study: decision to classify outcome may be affected by knowledge of exposure status. Especially “soft” outcomes such as migraine, or psychiatric symptoms • Eg: assignment of diagnosis of hypertensive end-stage renal disease (ESRD). Nephrologists sent case histories were twice as likely to diagnose “black” patients with ESRD than “white” patients”.
Preventing Observer Bias • Mask observers in charge of classifying outcome with respect to exposure status • Multiple observers
2.2 Respondent Bias • Most often examples are in case-control studies where biases are associated with identification of exposure. • Eg: Parents may be more likely to identify having given their children aspirin in a case-control study of Reyes syndrome compared to population controls
2.2 Respondent Bias • In a Cohort study: respondents may respond with little consistency to un-standardized questions or to “subjective” questions. • Eg. Questions about depression may be very subjective. A solution is to use a standardized instrument. • Eg. 2: Have you witnessed an overdose?
3. The result of information bias: Misclassification • Nondifferential misclassification • Differential misclassification
3.1 Nondifferential Misclassification • Occurs when the degree of misclassification of exposure is independent of case-control status (vice-versa) • Example: misclassification of HCV infection due to window period in a study looking at risk factors for HCV. Both the exposed and the unexposed are equally likely to be misclassified as unexposed.
Misclassification of OUTCOME REFERENCE POPULATION Diseased + - + - Exposed Cases Control Eg…cases in this are mistakenly classified as controls due to low sensitivity on a screening test STUDY SAMPLE
Nondifferential Misclassification No misclassification Exposure Cases Controls Yes 50 20 No 50 80 OR= (50/50)/(20/80) or (50*80)/(50*20) = 4.0 30% Exposure misclassification in each group Exposure Cases Controls Yes 50-15=35 20-6=14 No 50+15=65 80+6=86 OR= (35*86)/(65*14) = 3.3 Effect of non-differential misclassification with 2 exposure categories: to bias the OR toward the null value of 1.0 • Example: misclassification of exposed subjects as unexposed in 30% of cases and 30% of controls
Application of sensitivity/specificity concepts in misclassification of exposure: schematic representation of true and misclassified relative odds. Sensitivity of exposure ascertainment= TP (TP +FN)Specificity of exposure ascertainment= TN (TN +FP) Cases Controls True Exp Unexp Exp Unexp OR (pos) (neg) (pos) (neg) True results A C B C [A/C B/D] Study total study total study MIS- Results cases controls classified OR Exp TP FP TP + FP = a TP FP TP + FP = b Unexp FN TN FN + TN = c FN TN FN + TN= d [a/cb/d] Figure 4-4
Effects of nondifferential misclassification on the odds ratio-->Since the sensitivity and specificity values are the same for cases and control,the effect is nondifferential Cases Controls True exp unexp exp unexp OR true distribution (gold standard) 50 50 20 80 50/5020/80 =4.0 Study distribution: Cases Controls Exposed 45 10 55 18 16 34 Unexposed 5 40 45 2 64 66 55/4534/66 =2.4 sensitivity (exp) or specificity (unexp) 0.90 0.80 0.90 0.80 Misclassified OR Exhibit 4-3
Nondifferential misclassification of exposure: effects of sensitivity and specificity of exposure identification and of exposure prevalence in controls on a study’s OR (true OR=4.0) Table 4-5
3.2 Differential Misclassification • Occurs when the degree of misclassification of exposure (outcome) differs between the groups being outcome (exposure) groups • Effect is: bias toward or away from the null
Effect of differential misclassification on the OR, in which, for Sensitivity Cases > Controls and, for specificity, Cases = Controls Cases Controls True exp unexp exp unexp OR true distribution (gold standard) 50 50 20 80 50/5020/80 =4.0 Study distribution: Cases Controls Exposed 48 0 48 14 0 14 Unexposed 2 50 52 6 80 86 48/5214/86 =5.7 sensitivity (exp) or specificity (unexp) 0.96 1.00 0.70 1.00 Misclassified OR Exhibit 4-5
Effect of differential misclassification on the OR, in which, for both Sensitivity and Specificity, Cases>Controls Cases Controls True exp unexp exp unexp OR true distribution (gold standard) 50 50 20 80 50/5020/80 =4.0 Study distribution: Cases Controls Exposed 48 0 48 14 16 30 Unexposed 2 50 52 6 64 70 48/5230/70 =2.1 sensitivity (exp) or specificity (unexp) 0.96 1.00 0.70 0.80 Misclassified OR Exhibit 4-6
Example: Weinstock et al’s study of melanoma associated with “hair color” and “tanning ability”. Table 4-8 • Nested case-control study allowed data collection at baseline and during follow-up • Participants were compared with regard to their report of “hair color” and “tanning ability” • Compared with pre-disease development, the odds for hair color use increased slightly only for controls when the postmelanoma interview data were used; Result: OR changed very little. • Differential misclassification of tanning ability was severe, leading to a reversal in the direction of the association.
Cases: 143 without a prior history of cancer who reported a melanoma (June 1976 to June 1984); responded to mailed questionnaire or telephone interview. Controls: 316 age-matched controls randomly sampled from the NHS cohort members w/out history of cancer