Download

1 / 12
120 likes | 574 Vues
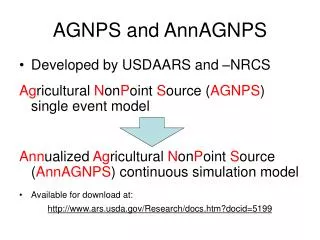
AGNPS USER `S GUIDE. * What is AGNPS * AGNPS development * Basic Theory of AGNPS * How to Prepare Data of AGNPS. What Is AGNPS. Name: Agricultural Non-Point Source Pollution Model Developed by : USDA-ARS: North Central Soil Conservation Research Laboratory

E N D
AGNPS USER`S GUIDE * What is AGNPS * AGNPS development * Basic Theory of AGNPS * How to Prepare Data of AGNPS
What Is AGNPS Name:Agricultural Non-Point Source Pollution Model Developed by:USDA-ARS: North Central Soil Conservation Research Laboratory Southeast Watershed Research Station Minnesota Pollution Control Agency The Function:Hydrological calculation: Rainfall and Runoff; Water contamination: sediment and chemical contamination; Water pollution control: point and non-point pollution. Data Input: Data Input is rather complicated: it needs input 22 data for each cell. There are also many operations. Output: Can obtain 24 Output value at the watershed outlet in Hydrology and Nutrient items:
1. Cell number (from) 2. Receiving cell number (to) 3. SCS curve number (CN) 4. Land slope 5. Land slope shape factor 6. Field slope length 7. Channel slope 8. Channel sideslope 9. Manning`s roughness coefficient 10. Soil erodibility factor 11. Cover and management factor 12. Support practice factor 13. Surface condition constant 14. Aspect (direction of drainage) 15. Soil texture 16. Fertilization level 17. Fertilization availability factor 18. Point source indicator 19. Gully source level 20 Chem. Oxy. Demand. (COD) factor 21. Impoundment factor 22 Channel indicator Input Data
Hydrology: 1. Runoff volume (inches) 2. Peak runoff rate (cf s) 3. Fraction of runoff within the cell 4. Sediment (by part. size and in total) 5. Sediment yield (tons) 6. Sediment concentration (ppm) 7. Sediment particle size distribution 8. Upland erosion (tons/acre) 9 Chemical erosion (tons/acre) 10. Amount of deposition (%) 12 Enrichment ratio 13. Delivery ratio Nutrient: 1. Nitrogen 2. Sediment associated mass (lbs/acre) 3. Concentration of soluble material 4. Mass of soluble material in runoff 5. Phosphorous 6. Sediment associated mass (lbs/acre) 7. Concentration of soluble material 8. Mass of soluble material in runoff 9. Chemical Oxygen Demand 10. Concentration (ppm) 11. Mass (lbs/acre) Output Data
AGNPS Development Agricultural Non-Point Source Pollution Control 1. The problem appeared in 1970s. The 1970 Clean Water Act (cwa) AND ITS SUBSEQUENT Amendments clearly considered NPS pollution as one of the most serious water quality problems. 2. In The Netherlands, Dr. Fedders, a professor in Wageningen Agricultural University, researched water models SWATRO and SALTBL from 1972. So far, they developed integrated model SWACROP. 3. After 1980s many countries pay attention to research Water models. And they gradually developed many advanced models, such as TANK model (Japan), STANFORD model, Sacramento Model (America), CROPWAT (Italy, FAO). 4. In China, the model research started from 1970s. The most famous models are Full Store Runoff model, Over Ratio Runoff model (River & Sea Univ.) and SPAC model (QingHua Univ.). In 1990, World Bank financed us to build a Non-Point Source Pollution laboratory in River and Sea University. This laboratory is largest one in Asia. Now, they are researching Yangzsi River pollution.
Basic Theory of AGNPS AGNPS developed based on Stanford Watershed Model The basic theories of AGNPS are: 1. Curve Number Methoddeveloped bySoil Conservation Service ( USDA SCS, 1972 and 1986) is a well-known hydrological method in the world. There are many hydrological models were developed based on the method (such as SWACROP, SWATRE, SALTBAL) and 2. Universal Soil Loss Equation (USLE):developed by Wischneier and Smith, 1978, is another well-known model for predicting soil erosion from agricultural fields. However, recently we found it was not suitable to the conditions of our country especially in our province and the formula is too general, it is influenced by many factors. So, we are looking for another good method to calculate soil erosion. Both Models are empirical approach with a focus on past experiences and large scale field tests are needed for parameters.
SCS Curve Number Model The function was set up from great deal of data test P The formula: F/S=Q/(P-Ia) Therefor, P=Ia+F+Q Q=(P-Ia)2/(P+S-Ia), P>=Ia Q=0 P<Ia NormallyIa= 0.2 S= 25400/CN- 254 CN( curve number) value varied depend on hydrological conditions, soil type, land use, vegetation, and crop pattern. F P Ia Q S Time P: precipitation; Q: Surface Runoff Ia: initial loss F: Current loss S: Potential loss, = max. value of F
Universal Soil Loss Equation (USLE) Although the formula is simply proportional to six parameters, each factor is based on a separate set of variables Each parameter is analyzed by statistical or experimental methods and experiences. Factors include topographic factors and land management factors considers crop rotation, tillage and planting methods, and cover residues. USLE formula : A=RKLSPC A= annual soil loss R=rainfall factor K=soil erodibility factor L=field slope length factor S=field slope factor P=supporting practice factor C=cover and management factor
Cell Number, Receiving cell Number Increase o’clock direction How divide cells and sub-divided cells 3221 3222 3210 3100 3223 3224 3230 3240 3310 3320 3400 3330 3340 + Slope shape factor Flow direction 8 1 2 N 7 3 6 5 4 1 = Uniform 2 = convex 3 = Concave