Download
1 / 56
560 likes | 1.14k Vues
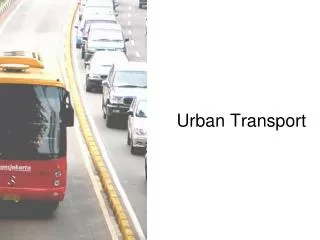
Mitigating Environmental Emissions from the Urban Transport System Ram M. Shrestha S.C. Bhattacharya Nazrul Islam N. T. Kim Oanh Asian Regional Research Programme in Energy, Environment and Climate (ARRPEEC) Asian Institute of Technology, Thailand Cities Covered City Profile ERI IGIDR

E N D
Mitigating Environmental Emissions from the Urban Transport System Ram M. Shrestha S.C. Bhattacharya Nazrul Islam N. T. Kim Oanh Asian Regional Research Programme in Energy, Environment and Climate (ARRPEEC) AsianInstituteofTechnology, Thailand COP8, 01 November 2002, New Delhi, India
Cities Covered COP8, 01 November 2002, New Delhi, India
City Profile COP8, 01 November 2002, New Delhi, India
ERI IGIDR ITB AIT SATMP DOSTE Project Network AIT—Asian Institute of Technology, Thailand DOSTE– Department of Science, Technology and Environment, Vietnam Prof. Nguyen Thien Nhan ERI—Energy Research Institute, China Dr. Zhou Dadi IGIDR—Indira Gandhi Institute of Development Research Prof. Jyoti Parikh ITB—Institut Technologi Bandung, Indonesia Dr. Tatang H. Soerawidjaja SATMP—Society for the Advancement of Technology in the Philippines, Philippines Dr. Joy V. Abrenica COP8, 01 November 2002, New Delhi, India
Study Objectives • To analyze the demand for urban transport services and associated energy demand and environmental emissions; • To analyze and select the technical options for energy efficiency improvement and mitigation of GHGs and other harmful emissions from the urban transport system; and • To identify and rank the barriers to the introduction of selected technical options to mitigate environmental emissions from the urban transport system. COP8, 01 November 2002, New Delhi, India
Travel Demand, Energy Demand and Associated Environmental Emissions COP8, 01 November 2002, New Delhi, India
Projection of Travel Demand GDP Growth Rate for BAU Projection (%) GDP Growth Rate for Alternative Scenarios Alternative Scenario 1 is 1.5 times BAU GDP growth rate Alternative Scenario 2 is 1.25 times BAU GDP growth rate Alternative Scenario 3 is 0.75 times BAU GDP growth rate Alternative Scenario 4 is 0.5 times BAU GDP growth rate COP8, 01 November 2002, New Delhi, India
Demand for Transport Services (p-km): BAU Projection • Annual average growth rate of demand for transport services would be in the range of 3.3% (Beijing) to 7.3% (HCMC) during 1998-2020. COP8, 01 November 2002, New Delhi, India
2020 2005 Trucks Bus 3% 7% Trucks Bus 2% 10% Car 26% Car 29% 2-Wheeler 2-Wheeler 64% 59% 2020 2005 Bus Trucks Bus Trucks 1% 12% 2-Wheeler 0% 9% 2-Wheeler 13% 7% Car Car 74% 84% Vehicle share (of the total vehicles) in Bandung and Beijing Bandung Beijing COP8, 01 November 2002, New Delhi, India
Others 2005 2020 Bus 2% Trucks Others Bus 1% Trucks 4% 2% 0% Car Car 4% 28% 32% 2-Wheeler 2-Wheeler 61% 66% 2020 2005 Trucks Bus Bus 2-Wheeler Trucks 4% 2% 6% 7% 25% Car 50% 2-Wheeler Car 19% 87% Vehicle share (of the total vehicles) in Delhi and Hangzhou Delhi Hangzhou COP8, 01 November 2002, New Delhi, India
2020 2005 Bus Car 0% 3% Bus Trucks Car Trucks 0% 1% 1% 1% 2-Wheeler 96% 2-Wheeler 98% 2005 2020 Others Others Trucks 1% Trucks Bus 0% Bus 12% 13% 10% Car Car 12% 18% 16% 2-Wheeler 57% 2-Wheeler 61% Vehicle share (of the total vehicles) in HCMC and Jakarta HCMC Jakarta COP8, 01 November 2002, New Delhi, India
Bus 2005 2020 2-Wheeler Car Others 1% Bus Car 8% 12% 51% Trucks 0% 34% 3% 2-Wheeler Trucks Others 9% 5% 77% Bus Bus 2005 2020 Others Others Trucks 1% 1% Trucks 10% 8% 3% Car Car 3% 34% 26% 2-Wheeler 2-Wheeler 52% 62% Vehicle share (of the total vehicles) in Manila and Mumbai Manila Mumbai COP8, 01 November 2002, New Delhi, India
Change in Model Mix (2005-2020) COP8, 01 November 2002, New Delhi, India
Car Ownership in 1998 and 2020 (Units/1000 population) • Beijing would have the highest car ownership among the cities (248 in 2020). However, the number would be still less than that in OECD countries. COP8, 01 November 2002, New Delhi, India
Bus Ownership in 1998 and 2020 (Units/1000 population) • Beijing would have the lowest bus ownership during the planning horizon. COP8, 01 November 2002, New Delhi, India
Two-wheeler Ownership in 1998 and 2020 (Units/1000 population) • 2-wheeler ownership would be relatively low in Beijing, Hangzhou and Manila COP8, 01 November 2002, New Delhi, India
Annual Average Growth Rate of Total Transport Energy Demand (1998-2020): BAU Projection • AAGR is above 5% in all Cities COP8, 01 November 2002, New Delhi, India
Share of CNG in Total Energy Demand in 2005 and 2020 (%) • The share of cleaner fuels, i.e. CNG, would increase in the future especially in the Indian cities of Mumbai and Delhi followed by Hangzhou Beijing and Jakarta. COP8, 01 November 2002, New Delhi, India
Average Annual Growth Rate of CO2 Emission During 1998-2020 (%) • Average annual growth rate: in the range of 3.1% (in Jakarta) to 12% (in Manila). • Total transport CO2 emissions from the eight cities: 53.8 million tonnes in 2020. COP8, 01 November 2002, New Delhi, India
Ratio of CO2 in 2020 to the Base Year (1998) Emission: BAU Projection COP8, 01 November 2002, New Delhi, India
1998 2020 Trucks Trucks Bus Bus 11% 15% 22% 5% 2-Wheelers 32% Car 48% 2-Wheelers Car 34% 33% 1998 2020 Trucks Bus 43% Trucks Bus 2% 16% 11% 2-Wheelers 16% 2-Wheelers 3% Car 43% Car 66% Modal Share in CO2 Emissions in Bandung and Beijing Bandung Beijing COP8, 01 November 2002, New Delhi, India
2020 1998 Bus Others Others Bus Trucks 23% 6% 10% 26% Trucks 20% 16% 2-Wheelers 12% 2-Wheelers Car Car 6% 45% 36% 1998 2020 Trucks Bus Trucks Bus 10% 25% 35% 2-Wheelers 25% 8% Car 2-Wheelers Car 37% 3% 57% Modal Share in CO2 Emissions in Delhi and Hangzhou Delhi Hangzhou COP8, 01 November 2002, New Delhi, India
2020 1998 Bus Bus 1% Others Others Car 6% Car 2% 1% 5% Trucks 7% Trucks 32% 29% 2-Wheelers 61% 2-Wheelers 56% 1998 2020 Bus Bus Others Others 13% 17% Trucks 2% 2% Trucks 26% 33% Car 34% 2-Wheelers Car 14% 2-Wheelers 41% 18% Modal Share in CO2 Emissions in HCMC and Jakarta HCMC Jakarta COP8, 01 November 2002, New Delhi, India
1998 2020 Bus Bus Others 4% 3% 34% Others 43% Car 46% Car Trucks 50% 8% Trucks 2-Wheelers 2-Wheelers 5% 3% 4% 1998 2020 Others 10% Others Trucks Bus Bus 19% 8% Trucks 45% 35% 6% 2-Wheelers 7% 2-Wheelers 5% Car Car 35% 30% Modal Share in CO2 Emissions in Manila and Mumbai Manila Mumbai COP8, 01 November 2002, New Delhi, India
Changes in Modal Share in CO2 Emission COP8, 01 November 2002, New Delhi, India
Ratio of Local Pollutants in 2020 to the Base Year (1998) Emission: BAU Projection • Among the cities, Mumbai would have the lower ratio due to the higher share of buses, use of CNG and penetration of 4-stroke 2-wheelers. • HCMC would have the higher ratio due to the higher share of 2-wheelers. COP8, 01 November 2002, New Delhi, India
Technical Options for CO2 Emission Mitigation COP8, 01 November 2002, New Delhi, India
Technology Options Considered for Emission Mitigation COP8, 01 November 2002, New Delhi, India
Least Cost CO2 Mitigation Options ADO—Additive diesel oil COP8, 01 November 2002, New Delhi, India
Least Cost CO2 Mitigation Options Contd.. • MRTS is cost effective at 20%, 40%, 25% and 40% CO2 reduction target in Bandung, Beijing, Hangzhou and HCMC respectively. COP8, 01 November 2002, New Delhi, India
Impact of CO2 Mitigation Target on Emissions of Local Pollutants • Local emission reduction objectives could still be served by focusing on CO2 emission reductions. • In the case of Beijing and Hangzhou, the introduction of efficient diesel car would reduce the emission level of CO, NOx and NMVOC. However, it would increase the emission of TSP. • TSP emission in Delhi would be reduced by 13% under 10% CO2 reduction target. • In Mumbai. TSP emission would be reduced 14% to 10%. • In the case of Manila, CO emissions would fall by 32% at 10% CO2 reduction. COP8, 01 November 2002, New Delhi, India
Selected Technical Options to Mitigate CO2 Emission • Bandung: LPG buses, bio-diesel buses and bio- ethanol buses • Beijing: CNG buses, diesel cars and MRTS • Delhi: CNG buses, CNG cars and 4-stroke 2-wheelers • Jakarta: CNG buses, LPG buses, bio-diesel buses and bio-ethanol buses • Hangzhou: CNG buses, diesel cars and MRTS • HCMC: MRT, Diesel bus • Manila: CNG buses, alco-diesel buses and (coconut methyl ester) CME buses • Mumbai: CNG cars, CNG 3-wheelers and BOV 3- wheelers COP8, 01 November 2002, New Delhi, India
Barriers to the Adoption of Efficient Options COP8, 01 November 2002, New Delhi, India
Barriers to the Adoption of Efficient Options • Barriers varies from: • Country to country • City to City • Technology to Technology • Technology specific barriers for each city were identified and the analysis of barriers are carried out using Analytic Hierarchy Process (AHP). COP8, 01 November 2002, New Delhi, India
Barriers to the Adoption of CNG Bus COP8, 01 November 2002, New Delhi, India
Barriers to the Adoption of Bio-fuel Buses in Manila COP8, 01 November 2002, New Delhi, India
Barriers to the Adoption of CNG Cars COP8, 01 November 2002, New Delhi, India
Barriers to the Adoption of MRTS COP8, 01 November 2002, New Delhi, India
Barriers to the Adoption of 4-Stroke 2-wheelers in Delhi COP8, 01 November 2002, New Delhi, India
Thank you COP8, 01 November 2002, New Delhi, India
Additional Information COP8, 01 November 2002, New Delhi, India
Project Approach Project Development (AIT, NRIs, Regional Experts/Policy Makers) Review of Methodology (NRIs) Development of Methodology (AIT) Country Case Studies (NRIs) Review of Case Studies (AIT) Cross-Country Synthesis (AIT) Publications (AIT, NRIs) Dissemination (NRIs, AIT) COP8, 01 November 2002, New Delhi, India
Methodology Population GDP Energy Intensity Emission Factor Econometric Model Vehicle Stocks Spread Sheet Model Transport Demand (p-km) LEAP Model Utilization, Occupancy Rate Energy Demand Emission COP8, 01 November 2002, New Delhi, India
Modal Mix in 2005 and 2020 under the BAU Case, % COP8, 01 November 2002, New Delhi, India
Structure of the Projected Energy Demand in 2005 and 2020 • The share of cleaner fuels, i.e. CNG, would increase in the future especially in the Indian cities of Mumbai and Delhi followed by the Chinese cities of Beijing and Hangzhou. COP8, 01 November 2002, New Delhi, India
City CO2 CO SOx NOx TSP Bandung 3.9 4.0 3.5 3.8 2.7 Beijing 4 1.2 1.5 3.5 6.2 Delhi 3.4 0.7 1.1 0.7 1.4 NA Hangzhou 5.6 5.3 6.0 2.0 NA HCMC 6.5 5.9 6.9 4.7 Jakarta) 2.9 2.9 3.0 3.2 2.1 Manila 3.3 3.3 3.3 1.8 3 Mumbai 3.3 0.6 0.7 0.4 0.7 Ratio of Environmental Emission in 2020 to the Base Year Emission COP8, 01 November 2002, New Delhi, India
Flow Chart of Methodology Candidate Options Costs Vehicle Penetration Rate Fuel Availability Emission target Transport Demand Data Vehicle-Mix Model Vehicular Mix Vehicle-km by mode Emission Factor Total Cost Total Emissions COP8, 01 November 2002, New Delhi, India
Least-Cost Vehicle Options Bandung and Jakarta • In the base case, the shares of gasoline vehicles in total passenger transport service supplied in both cities would be decreasing while that of additive diesel oil (ADO) and LPG would be increasing • At 20% reduction target, LPG and bio-diesel vehicles (car, minibus, truck, and bus), and MRT would be cost effective options to meet the CO2 reduction target in Bandung. The share of bio-diesel vehicles at 20% target would be 24.6% in 2020. • In the case of Jakarta, LPG car would be selected at 10% reduction target and bio-diesel vehicles (car, bus, jeep, minibus, bus, pick up and truck) and MRT would be selected at 40% reduction target. The share of bio-diesel vehicles and MRT at 40% reduction target would be 42.6% and 4.8% respectively in 2020 in Jakarta. COP8, 01 November 2002, New Delhi, India
Least-Cost Vehicle Options Contd..Beijing and Hangzhou • Under Base Case, the shares of gasoline car and diesel buses on total passenger kilometer supplied would increase in both cities. • To achieve a reduction of 10% CO2 emission, gasoline cars needs to be replaced by diesel cars. • At higher emission reduction target of 40% for Beijing and 25% for Hangzhou, the share of MRTS would increase substantially. • The shares of diesel-buses in total passenger transport service supplied in different years would reduce significantly when the emission reduction target is increased from 30% to 40% for Beijing and 20% to 25% for Hangzhou. COP8, 01 November 2002, New Delhi, India
Least-Cost Vehicle Options Contd..Delhi and Mumbai • Among the technologies considered, CNG buses would supply highest share of the transport services in passenger-km in Delhi while diesel buses would supply highest share of the transport services in Mumbai. • In Delhi, at higher emission reduction target level of 25%, diesel buses would replace the gasoline and diesel cars. • In the case of Mumbai, CNG buses would replace diesel buses at the emission reduction target of 5% while at higher emission reduction target of 30% battery operated 3-wheelers (2.5% in 2020) would replace the diesel 3-wheelers. COP8, 01 November 2002, New Delhi, India