Download
1 / 15
150 likes | 156 Vues
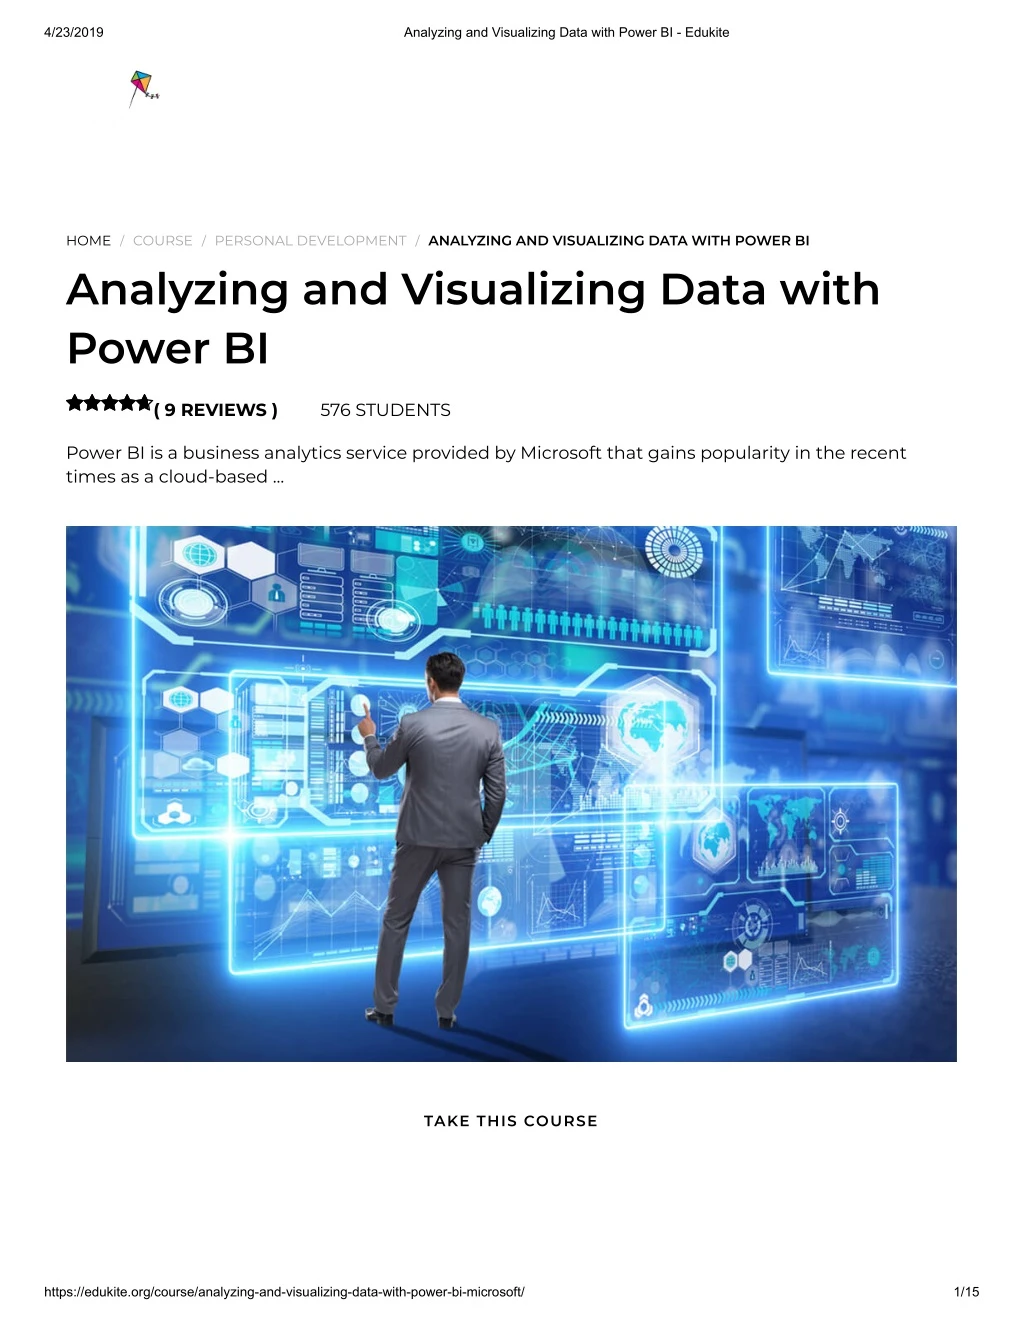
Power BI is a business analytics service provided by Microsoft that gains popularity in the recent times as a cloud-based service. It offers interactive visualisations with self-service business intelligence capabilities, where end users can create reports and share insights from their organisationsu2019 data.<br>See More: https://bit.ly/2Vn1JEh

E N D
4/23/2019 Analyzing and Visualizing Data with Power BI - Edukite HOME / COURSE / PERSONAL DEVELOPMENT / ANALYZING AND VISUALIZING DATA WITH POWER BI Analyzing and Visualizing Data with Power BI ( 9 REVIEWS ) 576 STUDENTS Power BI is a business analytics service provided by Microsoft that gains popularity in the recent times as a cloud-based … TAKE THIS COURSE https://edukite.org/course/analyzing-and-visualizing-data-with-power-bi-microsoft/ 1/15
4/23/2019 Analyzing and Visualizing Data with Power BI - Edukite FREE 1 YEAR LEVEL 2 - CERTIFICATE COURSE BADGE COURSE CERTIFICATE 122 NUMBER OF UNITS 0 NUMBER OF QUIZZES 7 HOURS, 3 MINUTES HOME CURRICULUM REVIEWS Power BI is a business analytics service provided by Microsoft that gains popularity in the recent times as a cloud-based service. It offers interactive visualisations with self-service business intelligence capabilities, where end users can create reports and share insights from their organisations’ data. The Analyzing and Visualizing Data with Power BI course focuses on Power BI and teaches you how to connect to and import your data, author reports using Power BI Desktop, and publish those reports to the Power BI service. You will also learn to create dashboards and share the dashboards with business users from both mobile devices and web. Assessment This course does not involve any written exams. Students need to answer 5 assignment questions to complete the course, the answers will be in the form of written work in pdf or word. Students can write the answers in their own time. Each answer needs to be 200 words (1 Page). Once the answers are submitted, the tutor will check and assess the work. Certification Edukite courses are free to study. To successfully complete a course you must submit all the assignment of the course as part of the assessment. Upon successful completion of a course, you can choose to make your achievement formal by obtaining your Certi?cate at a cost of £49. Having an Of?cial Edukite Certi?cation is a great way to celebrate and share your success. You can: https://edukite.org/course/analyzing-and-visualizing-data-with-power-bi-microsoft/ 2/15
4/23/2019 Analyzing and Visualizing Data with Power BI - Edukite Add the certi?cate to your CV or resume and brighten up your career Show it to prove your success Course Credit: Microsoft COURSE CURRICULUM Introduction Meet the Presenters 00:01:00 Introduction 00:02:00 Overview of Power BI 00:05:00 Connecting to Software as Services 00:04:00 Introduction Summary 00:01:00 Power BI Desktop Data Transformations Power BI Desktop Data Transformations – Introduction 00:01:00 Connecting to a Database 00:03:00 Basic Transformations 00:07:00 Managing Query Groups 00:02:00 Splitting Columns 00:03:00 Changing Data Types 00:03:00 Working with Dates 00:02:00 https://edukite.org/course/analyzing-and-visualizing-data-with-power-bi-microsoft/ 3/15
4/23/2019 Analyzing and Visualizing Data with Power BI - Edukite Removing and Reordering Columns 00:02:00 Conditional Columns 00:04:00 Connecting to Files in a Folder 00:07:00 Merge Queries 00:03:00 Query Dependency View 00:03:00 Transforming Less Structured Data 00:06:00 Enter Data 00:04:00 Query Parameters 00:06:00 Power BI Desktop Data Transformations – Summary 00:01:00 Power BI Desktop Modelling Power BI Desktop Modelling – Introduction 00:02:00 Managing Data Relationships 00:05:00 Creating Calculated Columns 00:04:00 Optimizing Models for Reporting 00:04:00 Creating Calculated Measures 00:08:00 Creating and Managing Hierarchies 01:06:00 Using Calculated Tables 00:02:00 Time Intelligence 00:03:00 https://edukite.org/course/analyzing-and-visualizing-data-with-power-bi-microsoft/ 4/15
4/23/2019 Analyzing and Visualizing Data with Power BI - Edukite Manually Typing in a Data Table 00:04:00 Include / Exclude 00:02:00 Grouping / Binning 00:03:00 Power BI Desktop Modelling – Summary 00:01:00 Power BI Desktop Visualization Power BI Desktop Visualization – Introduction 00:01:00 Pie and Treemap 00:05:00 Hierarchical Axis and Concatenating 00:02:00 Filter (Including TopN) 00:02:00 Bar Chart with Line (Combo Chart) 00:02:00 Analytics Pane 00:03:00 Clustering (and Machine Learning) 00:05:00 Slicers 00:07:00 Focus Mode and See Data 00:03:00 Date Slicer 00:02:00 Map Visualizations 00:03:00 ESRI Map 00:06:00 Table and Matrix 00:06:00 https://edukite.org/course/analyzing-and-visualizing-data-with-power-bi-microsoft/ 5/15
4/23/2019 Analyzing and Visualizing Data with Power BI - Edukite Table Styles 00:02:00 Scatter Chart 00:04:00 Waterfall Chart 00:02:00 Gauge, Card, and KPI 00:06:00 Coloring Charts 00:03:00 Shapes, textboxes and image 00:03:00 Gridlines and Snap to Grid 00:02:00 Power BI Service Power BI Service – Introduction 00:01:00 Overview of Dashboards and Service 00:03:00 Uploading to Power BI Service 00:01:00 Quick Insights 00:04:00 Con?guring a Dashboard 00:03:00 Adding Textbox, Image Widgets 00:02:00 Featured and Favorite Dashboard 00:03:00 Filtering Dashboard 00:01:00 Dashboard Settings 00:02:00 Natural Language Queries 00:04:00 https://edukite.org/course/analyzing-and-visualizing-data-with-power-bi-microsoft/ 6/15
4/23/2019 Analyzing and Visualizing Data with Power BI - Edukite Featured Questions 00:02:00 Sharing a Dashboard 00:03:00 Focus Mode 00:02:00 Pinning a Live Page 00:02:00 Custom URL and Title 00:03:00 TV Mode and Collapse Navigation 00:02:00 Printing Dashboard and Exporting Data 00:02:00 Export to CSV and Excel 00:03:00 Power BI Noti?cations 00:02:00 Alerts in the Power BI Service 00:03:00 Personal Gateway 00:04:00 Publishing to Web 00:02:00 Admin Portal 00:03:00 Viewing Power BI Dashboard Viewing in Windows App 00:03:00 Viewing in Android App 00:03:00 Viewing in iPad 00:02:00 Viewing in iPhone 00:02:00 https://edukite.org/course/analyzing-and-visualizing-data-with-power-bi-microsoft/ 7/15
4/23/2019 Analyzing and Visualizing Data with Power BI - Edukite Power BI Service – Summary 00:01:00 Working with Excel Working with Excel – Introduction 00:01:00 Importing Excel Data using Simple Table 00:02:00 Excel Workbook with Excel Data Model 00:03:00 Connecting to Excel Workbook on OneDrive for Business 00:05:00 Pinning Excel Tables or Visuals 00:06:00 Analyzing Data in Excel 00:03:00 Working with Excel – Summary 00:01:00 Organization Packs, Security and Groups Organization Packs, Security and Groups – Introduction 00:01:00 Creating a Group 00:02:00 Creating a Content Pack 00:02:00 Using a Content Pack 00:02:00 Editing a Content Pack 00:02:00 OneDrive for Business Integration 00:03:00 Row Level Security 00:05:00 Data Classi?cation 00:04:00 https://edukite.org/course/analyzing-and-visualizing-data-with-power-bi-microsoft/ 8/15
4/23/2019 Analyzing and Visualizing Data with Power BI - Edukite Organization Packs, Security and Groups – Summary 00:01:00 Direct Connectivity Direct Connectivity – Introduction 00:01:00 Direct Connectivity to SQL Azure 00:00:00 Direct Connectivity to SQL Database 00:04:00 Direct Connectivity to SSAS 00:03:00 Using SSAS Connector 00:03:00 SSAS Multi Dimensional Preview 00:03:00 SAP HANA 00:02:00 Direct Connectivity – Summary 00:01:00 Developer API Developer API – Introduction 00:01:00 Interactive API Console 00:06:00 Registering a Client App and Embedding a Tile 00:05:00 Using PubNub to Push Data to a Tile 00:05:00 Using Custom Visuals 00:06:00 Using Custom Visuals 00:06:00 Power BI Embedded 00:02:00 https://edukite.org/course/analyzing-and-visualizing-data-with-power-bi-microsoft/ 9/15
4/23/2019 Analyzing and Visualizing Data with Power BI - Edukite Mobile App Mobile App – Introduction 00:06:00 Report Gallery and Search 00:02:00 Mobile Dashboard Layout 00:03:00 Sharing and Annotating in Power BI Mobile 00:03:00 Taking Your Mobile Content Of?ine 00:01:00 Platform Speci?c Features 00:03:00 Search and Recent 00:01:00 Limiting Access to Mobile + MAM 00:02:00 Assessment Submit Your Assignment 00:00:00 Certi?cation 00:00:00 COURSE REVIEWS 4.7 9 ratings https://edukite.org/course/analyzing-and-visualizing-data-with-power-bi-microsoft/ 10/15
4/23/2019 Analyzing and Visualizing Data with Power BI - Edukite 0 5 STARS 0 4 STARS 0 3 STARS 0 2 STARS 0 1 STARS NO REVIEWS FOUND FOR THIS COURSE. RELATED COURSES https://edukite.org/course/analyzing-and-visualizing-data-with-power-bi-microsoft/ 11/15
4/23/2019 Analyzing and Visualizing Data with Power BI - Edukite Steam and Gas Power Systems FREE 1441 Certi?cate in Multiphase Flows FREE 1247 https://edukite.org/course/analyzing-and-visualizing-data-with-power-bi-microsoft/ 12/15
4/23/2019 Analyzing and Visualizing Data with Power BI - Edukite Digital Elevation Models and Applications FREE 1255 576 STUDENTS ENROLLED https://edukite.org/course/analyzing-and-visualizing-data-with-power-bi-microsoft/ 13/15
4/23/2019 Analyzing and Visualizing Data with Power BI - Edukite BEST RECOMMEND COURSES 1909: The People’s Budget ( 9 REVIEWS ) 1253 STUDENTS 21st Century Marketing ( 6 REVIEWS ) 720 STUDENTS 70-697 – Con?guring Windows Devices ( 7 REVIEWS ) 1334 STUDENTS SUBSCRIBE TO OUR NEWSLETTER Get top tips & guidance from our in-house study abroad experts Your Email Submit USEFUL LINKS About Terms & Conditions Privacy Policy Cookie Policy Contact INQUIRY https://edukite.org/course/analyzing-and-visualizing-data-with-power-bi-microsoft/ 14/15
4/23/2019 Analyzing and Visualizing Data with Power BI - Edukite 3 Lower Thames Street,London,EC4R 6HE. 020 3934 9675 info@edukite.org COPYRIGHT © BY EDUKITE https://edukite.org/course/analyzing-and-visualizing-data-with-power-bi-microsoft/ 15/15