Download
1 / 11
110 likes | 448 Vues
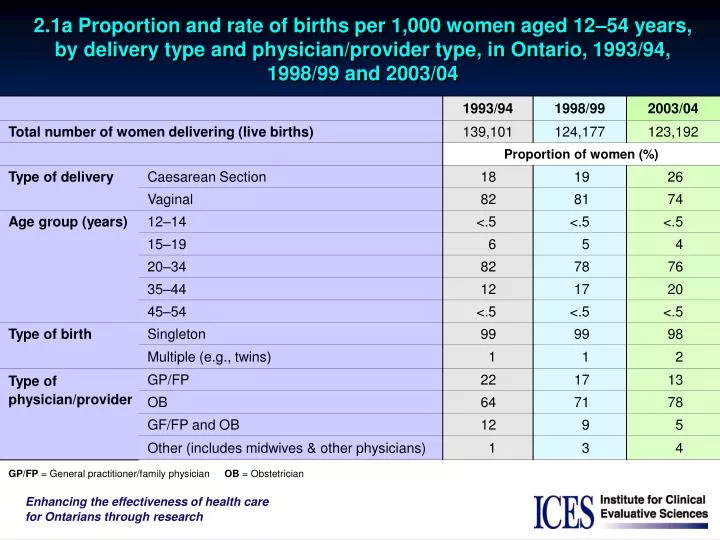
2.1a Proportion and rate of births per 1,000 women aged 12 – 54 years, by delivery type and physician/provider type, in Ontario, 1993/94, 1998/99 and 2003/04.

E N D
2.1a Proportion and rate of births per 1,000 women aged 12–54 years, by delivery type and physician/provider type, in Ontario, 1993/94, 1998/99 and 2003/04
2.1b Proportion and rate of births per 1,000 women aged 12–54 years, by delivery type, by physician/provider type, in Ontario, 1993/94, 1998/99 and 2003/04
2.2 Proportion of women receiving prenatal care, by physician type, in Ontario, 1993/94, 1998/99 and 2003/04 100 80 60 40 20 0 Proportion of women (%) 1993/94 1998/99 2003/04 Fiscal year • This includes women whose physician did not bill the Ontario Health Insurance Plan (OHIP), those who were seen predominantly by midwives or nurse practitioners and those who received little or no prenatal care (<4 visits). • ** Some women receive the majority of their prenatal care (≥75% of their OHIP visits) from GP/FPs while others receive the majority of their care (≥75% of their OHIP visits) from OBs. In other women, prenatal care is “shared” more evenly between OBs and GP/FPs. • GP/FP = General practitioner/family physician OB = Obstetrician
2.3 Proportion of women receiving prenatal care, by physician type, Local Health Integration Network, and for the Province of Ontario, 2003/04 All Ontario North West 14 South East 10 North Simcoe Muskoka 12 North East 13 South West 2 • This includes women whose physician did not bill the Ontario Health Insurance Plan (OHIP), those who were seen predominantly by midwives or nurse practitioners and those who received little or no prenatal care (<4 visits). • ** Some women receive the majority of their prenatal care (≥75% of their OHIP visits) from GP/FPs while others receive the majority of their care (≥75% of their OHIP visits) from OBs. In other women, prenatal care is “shared” more evenly between OBs and GP/FPs. • GP/FP = General practitioner/family physician • OB = Obstetrician Central West 5 Local Health Integration Network Champlain 11 Central East 9 Hamilton Niagara Haldimand Brant 4 Mississauga Halton 6 Toronto Central 7 Wellington Waterloo 3 Central 8 Erie St. Clair 1 0 20 40 60 80 100 Proportion of women (%)
2.4 Number and proportion of women receiving prenatal care, by physician type and neighbourhood income quintile*, in Ontario, 2003/04
2.5 Average number of prenatal visit billings, per pregnancy, by provider type, in Ontario, 1993/94, 1998/99 and 2003/04 * This includes women whose physician did not bill the Ontario Health Insurance Plan (OHIP), those who were seen predominantly by midwives or nurse practitioners and those who received little or no prenatal care (<4 visits). ** Some women receive the majority of their prenatal care (≥75% of their OHIP visits) from GP/FPs while others receive the majority of their care (≥75% of their OHIP visits) from OBs. In other women, prenatal care is “shared” more evenly between OBs and GP/FPs. GP/FP = General practitioner/family physician OB = Obstetrician
2.6 Average number of visits per 1,000 women to internal medicine specialists and paediatricians/geneticists during the prenatal period, in Ontario, 1993/94, 1998/99 and 2003/04
2.7 Distribution of physicians attending deliveries, by provider type, Local Health Integration Network, and for the Province of Ontario, 2003/04
2.8 Number and proportion of midwife-assisted births*, by age and location of birth (home or hospital), in Ontario, 2000/01–2003/04
2.9 Number and proportion of midwife-assisted births, by Local Health Integration Network, in Ontario, 2003/04
2.10 Number and proportion of women receiving prenatal and intrapartum care from midwives, by neighbourhood income quintile*, in Ontario, 2003/04