Download
1 / 116
1.16k likes | 1.61k Vues
No Data <10% 10%–14%. Obesity Trends* Among U.S. Adults BRFSS, 1985. (*BMI ≥30, or ~ 30 lbs overweight for 5’ 4” woman). No Data <10% 10%–14%. Obesity Trends* Among U.S. Adults BRFSS, 1986. (*BMI ≥30, or ~ 30 lbs overweight for 5’ 4” woman).

E N D
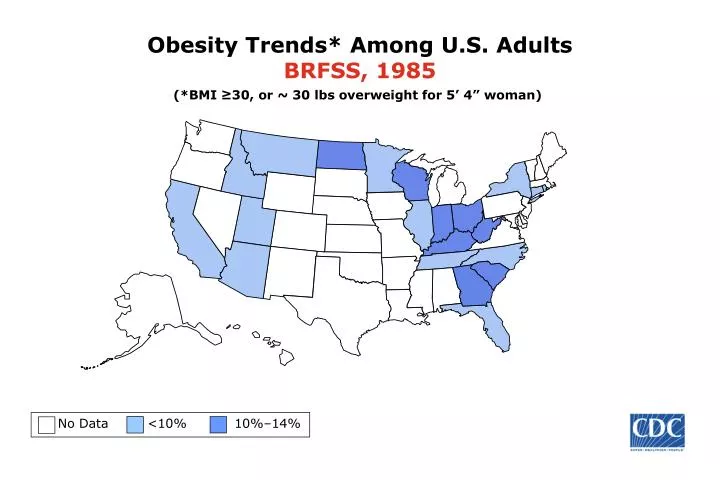
No Data <10% 10%–14% Obesity Trends* Among U.S. AdultsBRFSS, 1985 (*BMI ≥30, or ~ 30 lbs overweight for 5’ 4” woman)
No Data <10% 10%–14% Obesity Trends* Among U.S. AdultsBRFSS, 1986 (*BMI ≥30, or ~ 30 lbs overweight for 5’ 4” woman)
No Data <10% 10%–14% Obesity Trends* Among U.S. AdultsBRFSS, 1987 (*BMI ≥30, or ~ 30 lbs overweight for 5’ 4” woman)
No Data <10% 10%–14% Obesity Trends* Among U.S. AdultsBRFSS, 1988 (*BMI ≥30, or ~ 30 lbs overweight for 5’ 4” woman)
No Data <10% 10%–14% Obesity Trends* Among U.S. AdultsBRFSS, 1989 (*BMI ≥30, or ~ 30 lbs overweight for 5’ 4” woman)
No Data <10% 10%–14% Obesity Trends* Among U.S. AdultsBRFSS, 1990 (*BMI ≥30, or ~ 30 lbs overweight for 5’ 4” woman)
No Data <10% 10%–14% 15%–19% Obesity Trends* Among U.S. AdultsBRFSS, 1991 (*BMI ≥30, or ~ 30 lbs overweight for 5’ 4” woman)
No Data <10% 10%–14% 15%–19% Obesity Trends* Among U.S. AdultsBRFSS, 1992 (*BMI ≥30, or ~ 30 lbs overweight for 5’ 4” woman)
No Data <10% 10%–14% 15%–19% Obesity Trends* Among U.S. AdultsBRFSS, 1993 (*BMI ≥30, or ~ 30 lbs overweight for 5’ 4” woman)
No Data <10% 10%–14% 15%–19% Obesity Trends* Among U.S. AdultsBRFSS, 1994 (*BMI ≥30, or ~ 30 lbs overweight for 5’ 4” woman)
No Data <10% 10%–14% 15%–19% Obesity Trends* Among U.S. AdultsBRFSS, 1995 (*BMI ≥30, or ~ 30 lbs overweight for 5’ 4” woman)
No Data <10% 10%–14% 15%–19% Obesity Trends* Among U.S. AdultsBRFSS, 1996 (*BMI ≥30, or ~ 30 lbs overweight for 5’ 4” woman)
No Data <10% 10%–14% 15%–19% ≥20 Obesity Trends* Among U.S. AdultsBRFSS, 1997 (*BMI ≥30, or ~ 30 lbs overweight for 5’ 4” woman)
No Data <10% 10%–14% 15%–19% ≥20 Obesity Trends* Among U.S. AdultsBRFSS, 1998 (*BMI ≥30, or ~ 30 lbs overweight for 5’ 4” woman)
No Data <10% 10%–14% 15%–19% ≥20 Obesity Trends* Among U.S. AdultsBRFSS, 1999 (*BMI ≥30, or ~ 30 lbs overweight for 5’ 4” woman)
No Data <10% 10%–14% 15%–19% ≥20 Obesity Trends* Among U.S. AdultsBRFSS, 2000 (*BMI ≥30, or ~ 30 lbs overweight for 5’ 4” woman)
Obesity Trends* Among U.S. AdultsBRFSS, 2001 (*BMI ≥30, or ~ 30 lbs overweight for 5’ 4” woman) No Data <10% 10%–14% 15%–19% 20%–24% ≥25%
Obesity Trends* Among U.S. AdultsBRFSS, 2002 (*BMI ≥30, or ~ 30 lbs overweight for 5’ 4” woman) (*BMI 30, or ~ 30 lbs overweight for 5’4” person) No Data <10% 10%–14% 15%–19% 20%–24% ≥25% Source: Behavioral Risk Factor Surveillance System, CDC
Obesity* Trends Among U.S. AdultsBRFSS, 2003 (*BMI ≥30, or ~ 30 lbs overweight for 5’ 4” person) No Data <10% 10%–14% 15%–19% 20%–24% ≥25%
Percent of adults who are overweight or obese 65% 2/3 of adults are overweight or obese
Excess Body Weight and Reduction of Lifespan -3.1 -3.3 -5.8 -7.1 Ann Intern Med. 2003;138:24-32
Diabetes Among Adults in the U.S.,BRFSS 1990 Source: Mokdad et al., Diabetes Care 2000;23:1278-83.
Diabetes Among Adults in the U.S.,BRFSS 1991-92 Source: Mokdad et al., Diabetes Care 2000;23:1278-83.
Diabetes Among Adults in the U.S.,BRFSS 1993-94 Source: Mokdad et al., Diabetes Care 2000;23:1278-83.
Diabetes Among Adults in the U.S.,BRFSS 1995-96 Source: Mokdad et al., Diabetes Care 2000;23:1278-83.
Diabetes Among Adults in the U.S.,BRFSS 1995 Source: Mokdad et al., Diabetes Care 2000;23:1278-83.
Diabetes Among Adults in the U.S.,BRFSS 1997-98 Source: Mokdad et al., Diabetes Care 2000;23:1278-83.
Diabetes Among Adults in the U.S.,BRFSS 1999 Source: Mokdad et al., Diabetes Care 2001;24:412.
Diabetes Among Adults in the U.S.,BRFSS 2000 Source: Mokdad et al., J Am Med Assoc 2001;286:10.
Diabetes Among Adults in the U.S.,BRFSS 2001 Source: Mokdad et al., J Am Med Assoc 2001;286:10.
Lifetime Risk of Diabetes for Children Born in 2000 Venkat Narayan, JAMA 2003;290:1884
Diabetes and Reduction in Lifespan -14.3 yrs -11.6 yrs JAMA 2003;290:1884-1890
Life Expectancy in the U.S. 2-5 year decline in life expectancy
Lifetime Risk for Chronic Diseases NCI Canada, 2.0; Lancet 1999;353:89
How People Died in 2003 Cancer 24 % Accidents Suicide Infections Kidney failure Lung failure Others… 40% Cardiovascular Disease 36%
How People Died in 2003 CVD Cancer Other Up to 70% of all causes of death are lifestyle related and preventable The Culprit and The Cure, 2005
National prevalence of lifestyle related health risks CDC, BRFSS, 2002
Percent of Selected Chronic Diseases That Are Likely Avoidable 91% 82% 71% 70% Sources: Stampfer, 2000; Platz, 2000; Hu, 2001
5-a-day = $1 million Food Marketing = $25 Billion