Download
1 / 44
450 likes | 883 Vues
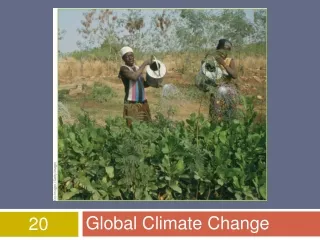
Equity and Global Climate Change Robert T. Watson Chairman, Intergovernmental Panel on Climate Change April 17, 2001 Pew Center Global Climate Change Global Climate Change A Threat to Sustainable Development, especially in Developing Countries The sustainable development challenge is to:

E N D
Equity and Global Climate Change Robert T. Watson Chairman, Intergovernmental Panel on Climate Change April 17, 2001 Pew Center Global Climate Change
Global Climate ChangeA Threat to Sustainable Development, especially in Developing Countries • The sustainable development challenge is to: • alleviate poverty for the 1.3 billion people who live on less than $1 per day and the 3 billion people who live on less than $2 per day • provide adequate food, especially for the 800 million people who are malnourished today—this will require food production to double in the next 35 years • provide clean water for the 1.3 billion people who live without clean water and provide sanitation for the 2 billion people who live without sanitation • provide energy for the 2 billion people who live without electricity • provide a healthy environment for the 1.4 billion people who are exposed to dangerous levels of outdoor pollution and the even larger number exposed to dangerous levels of indoor air pollution • provide safe shelter for those that live in areas susceptible to civil strife due to environmental degradation and those vulnerable to natural disasters
Environmental Links Dimensions of Poverty Examples of Determinants agriculture, forests Income and Consumption Access to markets Opportunity Water quantity, quality and sanitation Health Air quality, Vector-borne and water-borne diseases Capability Education Security Ecological fragility Vulnerability Natural shocks, e.g., severe weather Participation in Empowerment Decision-making Environmental governance Poverty is Multi-Dimensional Natural Resources, e.g., Environmental awareness
Key Conclusions from WG I • The Earth’s climate is changing • global mean surface temperature increased 0.6oC between 1861 and 2000 • rainfall patterns have changed with more heavy precipitation events • the El-Nino phenomena has become more frequent, persistent and intense • sea level increased 10-20 cm between 1900 and 2000 • Human activities are changing the atmospheric concentrations of greenhouse gases • combustion of fossil fuels • deforestation • There is new and stronger evidence that most of the observed warming of the past 50 years is attributable to human activities
Indicators of the Human Influenceon the Atmosphere during the Industrial Era
Precipitation Trends (%)per Decade (1900-1994)Green • = increasing / Brown •= decreasing
Percent of the Continental U.S. with A MuchAbove Normal Proportion of Total Annual Precipitation From 1-day Extreme Events(more than 2 inches or 50.8mm) Source: Karl, et.al. 1996.
Frequency, Persistence and Magnitude of the El-Nino Phenomena El Niño years La Niña years *As shown by changes in sea-surface temperature (relative to the 1961-1990 average) for the eastern tropical Pacific off Peru.
Key Conclusions from WG I and II • Observed regional changes in temperature have been associated with observed changes in physical, ecological and socio-economic systems world-wide, examples include: • non-polar glacier retreat • reduction in Arctic sea ice extent and thickness in summer • earlier plant flowering and longer growing season in Europe • poleward and upward (elevation) migration of plants, insects and animals • earlier bird arrival and egg laying • increased incidence of coral bleaching • increased economic losses due to extreme weather events
Number of Billion Dollar Weather DisastersUnited States of America
Key Conclusions from SRES and WG I • Future emissions of greenhouse gases and sulfate aerosol precursors depend on population growth, economic growth, technological changes and governance structures • All SRES scenarios project an increase in the atmospheric concentrations of greenhouse over the next 100 years, but decreases in sulfate aerosols by 2100 • Climate models project that: • the Earth’s mean annual surface temperature will increase by about 1.4 to 5.8oC between 1990 and 2100 with land areas warming more than oceans • precipitation will increase globally, with both increases and decreases locally, and with more heavy precipitation events • sea level will rise between 9-88 cm between 1990 and 2100 • incidence of extreme weather events will increase, e.g., floods, droughts, heat waves • stabilization levels between 450 and 1000 ppm of CO2 are projected to result in temperature and sea level increases of 1.5 to 9oC and 0.5 to 10 m.
1990 2100 • Population (billion) 5.3 7.0 - 15.1 • World GDP (1012 1990US$/yr) 21 235 - 550 • Per capita income ratio: 16.1 1.5 - 4.2developed countries to developing countries • Final energy intensity (106J/US$)a 16.7 1.4 - 5.9 • Primary energy (1018 J/US$) 351 514 - 2226 • Share of coal in primary energy (%)a 24 1 - 53 • Share of zero carbon in primary energy (%)a 18 28 - 35 Scenarios a 1990 values include non-commercial energy consistent with IPCC WGII SAR (Energy Primer) but with SRES accounting conventions. Note that ASF, MiniCam, and IMAGE scenarios do not consider non-commercial renewable energy. Hence, these scenarios report lower energy use.
Variations of the Earth’s Surface Temperature: 1000 to 2100 • 1000 to 1861, N. Hemisphere, proxy data; • 1861 to 2000 Global, Instrumental; • 2000 to 2100, SRES projections
Annual Mean Temperature Change, 2071 to 2100: Global Average in 2085 A2 = 3.1oC B2 = 2.4oC
Projected Changes in Annual Precipitation for the 2050s The projected change in annual precipitation for the 2050s compared with the present day, when the climate model is driven with an increase in greenhouse gas concentrations equivalent to about a 1% increase per year in CO2. The Met Office. Hadley Centre for Climate Prediction and Research.
Key Conclusions from WG I • An increase in extreme weather events • higher maximum temperatures, hot days and heat waves over nearly all land areas (very likely) • higher minimum temperatures, fewer cold days, frost days and cold spells over nearly all land areas (very likely) • more intense precipitation events over many areas (very likely) • increased summer drying over most mid-latitude continental interiors and associated risk of drought (likely) • increase in tropical cyclone peak wind intensity, mean and peak precipitation intensities (likely) • intensified floods and droughts associated with El-Nino events in many regions (likely) • increased Asian summer monsoon precipitation variability (likely)
Key Conclusions of WG II • Projected adverse consequences of climate change • decreasedwater availability in many water scarce regions, especially in arid and semi-arid lands in the sub-tropics • reduction inagricultural productivity: (a) in the tropics and sub-tropics for almost any warming, and (b) in mid-latitudes for warming more than a few degrees • changes in the productivity and composition of ecological systems, with coral reefs and forests being most vulnerable • increased risk of floods, potentially displacing millions of people, due to sea level rise and heavy rainfall events, especially in small island states and low-lying deltaic areas • increased incidence of heat stress mortality, and the number of people exposed to vector-borne diseases, such as malaria and dengue and water-borne diseases such as cholera, especially in the tropics and sub-tropics
Key Conclusions of WG II Continued • Projected beneficial consequences of climate change • increased agricultural productivity in some mid-latitude regions for increases in warming of up to a few degrees • increased water availability in some water-scarce regions, e.g., in some parts of S. East Asia • reduced winter mortality in mid- and high-latitudes • a potential increase in global timber supply from appropriately managed forests
Crop Yield Change Percentage change in average crop yields for the climate change scenario. Effects of CO2 are taken into account. Crops modeled are: wheat, maize and rice. Jackson Institute, University College London / Goddard Institute for Space Studies / International Institute for Applied Systems Analysis 97/1091 16
Zimbabwe’s Rainfall Record 1980-1993 Source: US Mission
Maize Production in Selected Southern African Countries* versus Niño 3 DataMalawi, Zimbabwe, Zambia 1970-1994 * The selected countries are agriculturally based economies.
Climate Change and Ecological Systems • Biological systems have already been affected by changes in climate at the regional scale • The structure and functioning of ecological systems will be altered and the biological diversity will decrease, especially in niche systems, e.g., alpine and arctic • forests, especially tropical and boreal forests are vulnerable due to changes in disturbance regimes (pests and fires), likely to change species composition • coral reefs are threatened by increases in temperature, more than increases in sea level - increased mortality • the current terrestrial uptake of carbon will likely diminish over time and forest systems may even become a source of carbon
People at Risk from a 44 cm Sea-level Rise by the 2080sAssuming 1990s Level of Flood Protection Source: R. Nicholls, Middlesex University in the U.K. Meteorological Office. 1997. Climate Change and Its Impacts: A Global Perspective.
Potential loss of land in Bangladesh due to a 1m rise in sea level Source: World Bank.
Likelihood of Population altered at risk distribution Disease Vector (millions) Present distribution with warming Malaria mosquito 2,100 (sub)tropics üü Schistosomiasis water snail 600 (sub)tropics üü Filariasis mosquito 900 (sub)tropics ü Onchocerciasis black fly 90 Africa/Latin America ü (river blindness) African tsetse fly 50 tropical Africa ü trypanosomiasis (sleeping sickness) Dengue mosquito unavailable tropics üü Yellow fever mosquito unavailable tropical South ü America & Africa Likely ü Very likely üü Vector (insect)-borne Diseases Source: Modified WHO, as cited in Stone (1995).
Changes in Falciparum Malaria Transmission Potential, vs. baseline scenario (HadCM2, with vector limits) 2020s vs 1990s:widespread proportional increases, +small increase in PAR (new risk) 2080s vs 1990s: greaterwidespread proportional increases, + [3-5]% increase in PAR (new risk) Multiplier >2 1 .9 to 2 1 .8 to 1 .9 1 .7 to 1 .8 1 .6 to 1 .7 1 .5 to 1 .6 1 .4 to 1 .5 1 .3 to 1 .4 1 .2 to 1 .3 1 .1 to 1 .2 1 to 1 .1 decrease new risk Martens, Kovats, McMichael, et al., 1999
Developing Countries are the Most Vulnerable to Climate Change • Climate change is likely to impact disproportionately upon the poorest countries and the poorest persons within countries, and thereby exacerbate inequities in health status and access to adequate food, clean water and other resources. • Net market sector effects are expected to be negative in most developing countries, but mixed for developed countries for a warming of up to a few degrees Centigrade. • A warming of greater than a few degrees Centigrade is likely to result in net market sector effects becoming negative for most countries
Why Developing Countries Are More Vulnerable:a) Impacts are worse Closer to margin of tolerance for temperature and precipitation changes (more drought- and flood-prone areas) Coastal vulnerability49 out of 50 countries with shore protection costs due to climate change above 0.5% of GDP are less developed countries Poorer nutrition and health infrastructure and therefore higher losses of human life Economic structure Larger share of the economy in climate sensitive sectors, such as agriculture
Why Developing Countries Are More Vulnerable:b) Lower capacity to adapt Availability of technology Institutional capacity Financial capacity Know-how and education
Co-Benefits - Adaptation • Many sectors (e.g., water resources and agriculture) are vulnerable to natural climate variability, e.g., floods and droughts associated with ENSO events • Identify technologies, practices and policies that can reduce the vulnerability of sectors to natural climate variability and can increase resilience to long-term climate change • incorporate modern scientific forecasts of ENSO events into sector management decisions • integrated multi-sector watershed management and appropriate water pricing policies • elimination of inappropriate agricultural subsidies • infrastructure design (e.g., buildings, bridges, roads)
The Challenge of Mitigation • The near-term Challenge is to achieve the Kyoto targets • The longer-term challenge is to meet the objectives of Article 2 of the UNFCCC, i.e., stabilization of the atmospheric concentrations of GHG concentrations at a level that does not harm the climate system (food security, ecological systems and sustainable economic development)
The Challenge of Mitigation • If governments decide to stabilize the atmospheric concentration of carbon dioxide at 550ppm (about twice the pre-industrial level), global emissions would have to peak by about 2025 and fall below current levels by 2040 to 2070. • This would mean that all regions would have to deviate from most “business-as-usual”scenarios within a few decades • a key issue would be an equitable distribution of emissions rights, recognizing that most anthropogenic emissions of greenhouse gases to date have come from industrialized countries, and that even though total emissions from developing countries will soon exceed those from industrialized countries, projected per-capita emissions would still be lower in developing countries
Co-Benefits - Mitigation • Co-benefits can lower the cost of climate change mitigation • Identify technologies, practices and policies that can simultaneously address local and regional environmental issues and climate change • energy sector • indoor and outdoor air quality • regional acid deposition • transportation sector • outdoor air pollution • traffic congestion • agriculture and forestry • soil fertility • biodiversity and related ecological goods and services
An Integrated Assessment Framework for Considering Climate Change Human & Natural Systems Climate change impacts Climate System • Floods and droughts • Biodiversity • Animal and plant health • Temperature rise • Sea level rise • Precipitation change Feedbacks Interactions Non-climate change stresses Enhanced greenhouse effect Environmental impacts Air pollution Atmospheric Concentrations Socio-Economic Development Paths Anthropogenic emissions • Carbon dioxide • Methane • Nitrous oxide • Aerosols • Main drivers are population, energy,economic growth, technology and land use
An Integrated Assessment Framework for Considering Climate Change Human & Natural Systems Climate change stresses Climate System • Floods and droughts • Biodiversity • Animal and plant health • Temperature rise • Sea level rise • Precipitation change Feedbacks Environmental impacts Interactions Non-climate change stresses Adaptation Air pollution Enhanced greenhouse effect Ancillary benefits AtmosphericConcentrations Socio-Economic Development Paths • Carbon dioxide • Methane • Nitrous oxide • Aerosols Mitigation • Main drivers are population, energy,economic growth, technology and land use Anthropogenic emissions
Key Conclusions • The key challenge is to identify adaptation and mitigation options that simultaneously address local and regional environmental and development issues and climate change, i.e., identify the synergies (co-benefits) and trade-offs among the issues