Download
1 / 41
410 likes | 1.01k Vues
The Global forex markets. By A.V. Vedpuriswar. Acknowledgement. This presentation draws heavily from BIS data and the Pacific Exchange Rate Service website maintained by Prof. Werner Antweiler of the University of British Columbia. Introduction. International Trade - Barter

E N D
The Global forex markets By A.V. Vedpuriswar
Acknowledgement • This presentation draws heavily from BIS data and the Pacific Exchange Rate Service website maintained by Prof. Werner Antweiler of the University of British Columbia
Introduction • International Trade - Barter • Bond issues to finance infrastructure projects in developing countries (19th century) • Gold Standard (1879 - 1934) • Bretton Woods (1944 - 1971) • 1960s: Decline of U.S Economy • 1971: Devaluation of Dollar • Managed / Dirty float • America, Germany first to free capital flows • Britain, 1979, Japan, 1980 (mostly) • France, Italy remove restrictions in 1990 • Currency Board in Hongkong, Argentina- Dollarisation? • Creeping peg in Brazil
Players : Individuals, corporate banks, central banks and securities firms • More than 97 % or trading is speculative • Trading almost around the clock
Global forex trading • Auckland • Sydney • Tokyo • Singapore • Frankfurt • Zurich • Paris • London • New York
Peak trading during European waking hours • New York most active when Europe is open • During afternoon, New York becomes more volatile • Worst time to trade - after New York closes but Sydney has not opened
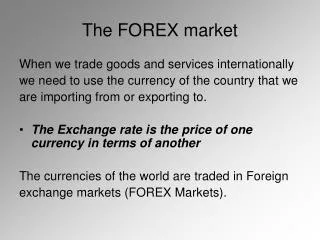
The foreign exchange market is unique because of • its trading volumes, • the extreme liquidity of the market, • the large number of, and variety of, traders in the market, • its geographical dispersion, • its long trading hours: 24 hours a day (except on weekends), • the variety of factors that affect exchange rates • the low margins of profit compared with other markets of fixed income (but profits can be high due to very large trading volumes) • As such, it has been referred to as the market closest to the ideal of perfect competition.
Unlike a stock market, where all participants have access to the same prices, the forex market is divided into levels of access. • At the top is the inter-bank market, which is made up of the largest investment banking firms. • Within the inter-bank market, spreads, which are the difference between the bid and ask prices, are razor sharp and usually unavailable, and not known to players outside the inner circle. • As we move to the next level of access, the difference between the bid and ask prices widens . • This is due to volume. • If a trader can guarantee large numbers of transactions for large amounts, they can demand a smaller difference between the bid and ask price, which is referred to as a better spread.
The levels of access that make up the forex market are determined by the size of the “line” (the amount of money with which they are trading). • The top-tier inter-bank market accounts for 53% of all transactions. • After that there are usually smaller investment banks, followed by large multi-national corporations (which need to hedge risk and pay employees in different countries), large hedge funds, and even some of the retail forex market makers. • Pension funds, insurance companies, mutual funds, and other institutional investors have played an increasingly important role in in FX markets, since the early 2000s. • Hedge funds have grown markedly over the 2001–2004 period in terms of both number and overall size. • Central banks also participate in the forex market to align currencies to their economic needs.
Foreign exchange market turnover • The April 2007 BIS data on turnover in traditional foreign exchange markets highlight several important features of the evolution of these markets. • First, average daily turnover has grown by an unprecedented 71% since April 2004, to $3.2 trillion. • This increase was much stronger than the one observed between 2001 and 2004. • Even after adjusting for the valuation effects arising from exchange rate movements, average daily turnover rose by 65%.
Growth in turnover • Growth in turnover was broad-based across instruments. • More than half of the increase in turnover can be accounted for by the growth in foreign exchange swaps, which rose 82% compared with 44% over the previous three-year period. • Changes in hedging activity may have been one factor underlying the increasing importance of foreign exchange swap instruments. • Growth in the turnover of outright forward contracts also picked up significantly to 74%. • In contrast, turnover in spot markets increased by 62%, roughly unchanged from growth in turnover in the previous three-year period.
Composition of turnover by counterparty • The composition of turnover by counterparty has changed substantially. • Transactions between reporting dealers and non-reporting financial institutions, such as hedge funds, mutual funds, pension funds and insurance companies, more than doubled between April 2004 and April 2007 and contributed more than half of the increase in aggregate turnover. • Factors underlying the strength of this segment include strong investor activity in an environment of financial market volatility, a trend shift among institutional investors with a longer-term investment horizon towards holding more internationally diversified portfolios and a marked increase in the levels of technical trading. • Turnover between reporting dealers and non-financial customers also more than doubled. • Consequently, the share of turnover resulting from transactions between reporting dealers, ie the interbank market, fell to 43%, despite growth in this segment being somewhat higher compared with the previous three-year period.
Currency composition of turnover • The currency composition of turnover has become more diversified over the past three years. • The share of the four largest currencies fell, although the US dollar/euro continued to be the most traded currency pair. • The most notable increases in share were for the Australian and New Zealand dollars, which have attracted attention from investors as high-yielding currencies, and the Hong Kong dollar, which has benefited from being associated with the economic expansion of China. • More broadly, the share of emerging market currencies in total turnover has increased, to almost 20% in April 2007 from less than 15% in April 2004.
Geographical distribution • The geographical distribution of foreign exchange trading did not change significantly. • Among countries with major financial centres, Singapore, Switzerland and the United Kingdom gained market share, while the shares of Japan and the United States dropped. • In some cases, changing shares reflected the relocation of desks.
OTC derivatives market turnover • Average daily turnover in OTC foreign exchange and interest rate contracts went up by 74% relative to the previous survey in 2004, to reach $4,198 billion in April 2007. • This corresponds to an annual compound rate of growth of 20%, which is higher than the 14% growth recorded since the derivatives part of triennial survey was started in 1995. • Activity in foreign exchange derivatives rose by 79%, slightly above the rate of increase reported for the spot market (62%). • More moderate growth was recorded in the interest rate segment, where turnover went up by 64%.
OTC derivatives notional amounts • Positions in OTC derivatives grew at an even more rapid pace than turnover. Notional amounts outstanding went up by 135% to $516 trillion at the end of June 2007. • This corresponds to an annualised compound rate of growth of 33%, which is higher than the approximately 25% average annual rate of increase since 1998. • Growth accelerated in all risk categories. • The highest rate of increase was reported in the credit segment of the OTC derivatives market, where positions expanded to $51 trillion, from under $5 trillion in the 2004 survey. • Notional amounts outstanding of commodity derivatives rose more than sixfold to $8 trillion, although this may reflect a change in the degree of underreporting as well as a genuine increase in positions.
Less extreme, but still high rates of growth were reported for the more traditional types of risk traded on the OTC derivatives market. • Open positions in interest rate contracts increased by 119% to $389 trillion, and those in equity contracts by 111% to $11 trillion. • Growth in notional amounts outstanding of OTC foreign exchange derivatives was less brisk at 83%, taking the volume of open positions in such contracts to $58 trillion.
OTC Derivatives : Gross market values • Notional amounts outstanding provide useful information on the structure of the OTC derivatives market. • But we also need a measure of the riskiness of these positions. • While a single comprehensive measure of risk does not exist, a useful concept is the cost of replacing all open contracts at the prevailing market prices. • This measure, called gross market value, increased at a considerably lower rate (74%) than notional amounts during the reporting period, to $11 trillion at the end of June.
Country’s choice of exchange rates • Openness • Size • Export dependence on a few commodities • Capital A/C Convertibility
Openness • Relatively closed economies may find it difficult to correct external imbalances using domestic policies. • They would prefer flexible exchange rates. • On the other hand, open economies would prefer fixed exchange rates.
Size • Small countries tend to prefer fixed exchange rates. • Economic policy can be tailored to meet the needs of the economy as a whole. • In a diversified large economy, flexible rates are preferable.
Export dependence on a few commodities • Fixed exchange rate preferable. • Otherwise disruptive effect on economy
Capital A/C Convertibility • Heavy inflows and outflows of capital create considerable difficulties in maintaining fixed exchange rate.
Maintaining a peg : How Currency Boardsoperate. • A currency board's foreign currency reserves must be sufficient to ensure that all holders of its notes and coins can convert them into the reserve currency (usually 110–115%). • A currency board maintains absolute, unlimited convertibility between its notes and coins and the currency against which they are pegged, at a fixed rate of exchange, with no restrictions on current-account or capital-account transactions. • A currency board only earns profit from interest on reserves (less the expense of note-issuing), and does not engage in forward-exchange transactions.
A currency board has no discretionary powers to effect monetary policy and does not lend to the government. Governments cannot print money, and can only tax or borrow to meet their spending commitments. • A currency board does not act as a lender of last resort to commercial banks, and does not regulate reserve requirements. • A currency board does not attempt to manipulate interest rates by establishing a discount rate like a central bank. • The peg with the foreign currency tends to keep interest rates and inflation very closely aligned to those in the country against whose currency the peg is fixed.
Examples of currencies with a currency board against the euro • Bulgarian lev • Estonian kroon • Bosnian mark (Konvertibilna marka) • Lithuanian litas • Examples of currencies with a currency board against the U.S. dollar • Hong Kong dollar • Bermudian dollar • Cayman Islands dollar • Djiboutian franc • East Caribbean dollar (Antigua and Barbuda, Dominica, Grenada, Saint Kitts and Nevis, Saint Lucia, and Saint Vincent and the Grenadines)
Examples of currencies with a currency board against the pound sterling • Falkland Islands pound • Gibraltar pound • Saint Helena pound • Examples of currency boards against other currencies • Brunei dollar, against the Singapore dollar • Macanese pataca, against the Hong Kong dollar • The Faeroe Islands have a de jure currency board, but in fact the Danish National Bank serves as the lender of last resort and all bank accounts are denominated in Danish kroner. The Danish National Bank refers to the Faroese króna as a "special version" of the Danish krone. • Examples of currencies that have historically had a currency board • Irish pound, pegged against pound sterling from independence until 1979.
Global financial architecture • 1994- Mexican Peso crisis • 1997- Asian currency crisis • 1998- Brazil/Russia • Weak financial systems • Poor supervision and regulation • Too much short term borrowing • False security of stable exchange rates • Once crisis struck, contagion effects because of interconnected financial markets. • Tables now turned. • Emerging market currencies looking strong now.
Emerging scenario • Floating exchange rates can overshoot but allow country to retain independence as far as monetary policies are concerned . • This freedom is however more limited than it looks prima facie. • For example, Indian interest rates cannot be set completely independent of the Fed. • Fixed rates mean subservience to monetary policies of another country. • Emerging scenario- Two groups of countries • Flexible exchange rates , relatively low level of integration into global capital markets. • Fixed exchange rates- Tightly integrated into global capital markets, foreign ownership.