Download
1 / 1
10 likes | 15 Vues
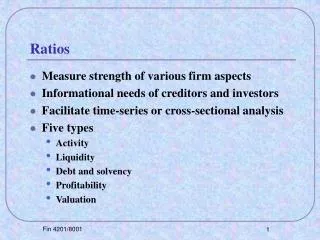
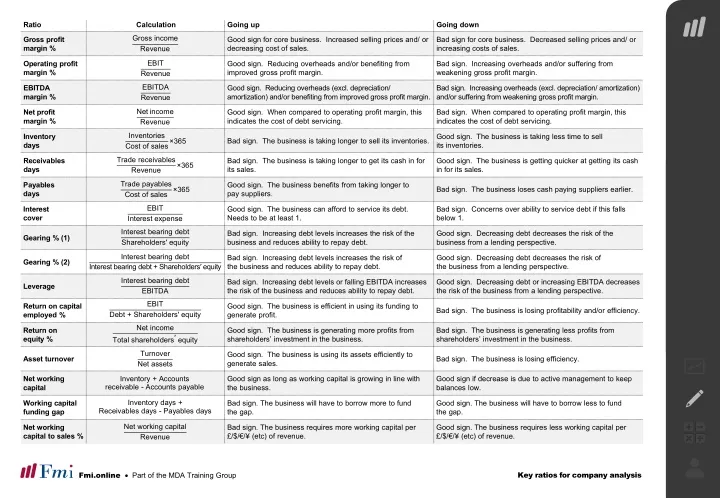
This useful download provides an overview of the key ratios used for company analysis by Analysts in banks.

E N D
Ratio Calculation Going up Going down Gross income Revenue Gross profit margin % Good sign for core business. Increased selling prices and/ or decreasing cost of sales. Bad sign for core business. Decreased selling prices and/ or increasing costs of sales. EBIT Revenue Operating profit margin % Good sign. Reducing overheads and/or benefiting from improved gross profit margin. Bad sign. Increasing overheads and/or suffering from weakening gross profit margin. EBITDA Revenue EBITDA margin % Good sign. Reducing overheads (excl. depreciation/ amortization) and/or benefiting from improved gross profit margin. Bad sign. Increasing overheads (excl. depreciation/ amortization) and/or suffering from weakening gross profit margin. Net income Revenue Net profit margin % Good sign. When compared to operating profit margin, this indicates the cost of debt servicing. Bad sign. When compared to operating profit margin, this indicates the cost of debt servicing. Inventories Cost of sales×365 Inventory days Good sign. The business is taking less time to sell its inventories. Bad sign. The business is taking longer to sell its inventories. Trade receivables Revenue Receivables days Bad sign. The business is taking longer to get its cash in for its sales. Good sign. The business is getting quicker at getting its cash in for its sales. ×365 Trade payables Cost of sales Payables days Good sign. The business benefits from taking longer to pay suppliers. Bad sign. The business loses cash paying suppliers earlier. ×365 EBIT Interest cover Good sign. The business can afford to service its debt. Needs to be at least 1. Bad sign. Concerns over ability to service debt if this falls below 1. Interest expense Interest bearing debt Shareholders′ equity Bad sign. Increasing debt levels increases the risk of the business and reduces ability to repay debt. Good sign. Decreasing debt decreases the risk of the business from a lending perspective. Gearing % (1) Interest bearing debt Interest bearing debt + Shareholders′ equity Bad sign. Increasing debt levels increases the risk of the business and reduces ability to repay debt. Good sign. Decreasing debt decreases the risk of the business from a lending perspective. Gearing % (2) Interest bearing debt EBITDA Bad sign. Increasing debt levels or falling EBITDA increases the risk of the business and reduces ability to repay debt. Good sign. Decreasing debt or increasing EBITDA decreases the risk of the business from a lending perspective. Leverage EBIT Return on capital employed % Good sign. The business is efficient in using its funding to generate profit. Bad sign. The business is losing profitability and/or efficiency. Debt + Shareholders′ equity Net income Return on equity % Good sign. The business is generating more profits from shareholders’ investment in the business. Bad sign. The business is generating less profits from shareholders’ investment in the business. Total shareholders′equity Turnover Net assets Good sign. The business is using its assets efficiently to generate sales. Asset turnover Bad sign. The business is losing efficiency. Inventory + Accounts receivable - Accounts payable Net working capital Good sign as long as working capital is growing in line with the business. Good sign if decrease is due to active management to keep balances low. Inventory days + Working capital funding gap Bad sign. The business will have to borrow more to fund the gap. Good sign. The business will have to borrow less to fund the gap. Receivables days - Payables days Net working capital Revenue Net working capital to sales % Bad sign. The business requires more working capital per £/$/€/¥ (etc) of revenue. Good sign. The business requires less working capital per £/$/€/¥ (etc) of revenue. Key ratios for company analysis Fmi.online • Part of the MDA Training Group