Download

1 / 28
280 likes | 797 Vues
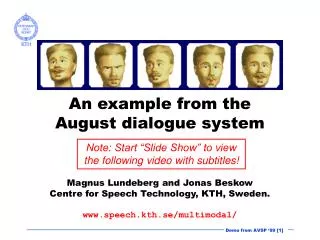
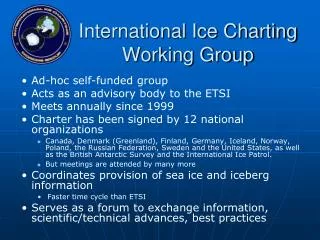
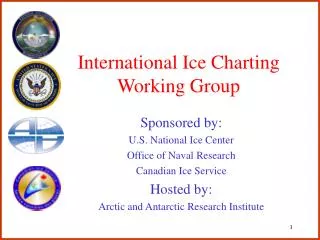
Ice Charting System in the Baltic- an example Robin Berglund, VTT Technical Research Centre of Finland IICWG 5 th meeting, Hamburg/Rostock April 19-22, 2004 Presentation purpose and contents

E N D
Ice Charting System in the Baltic-an example Robin Berglund, VTT Technical Research Centre of Finland IICWG 5th meeting, Hamburg/Rostock April 19-22, 2004
Presentation purpose and contents • Purpose: to give an overview of the present status of IceMap and to present how ice information is transferred and used by one important end user group: the icebreakers. • Contents: • IceMap • IBNet, IBPlott systems
VTT Information Technology • A government owned research institute • We help companies derive maximum benefit from the rapid progress in microelectronics, information technology and media technology. • About 400 employees, annual turnover 40 M€ • Remote sensing is one of the research areas • IceMap is one example of a Customer specific systems development
IceMap • An interactive editing tool for creating maps using satellite images as templates • Based on polygon networks: attibutes can be assigned to areas defined as polygons. These attributes are related to the visual appearance (hatching), but also to properties like ice thickness etc. • Output formats: Postscript, Grid (attribute values at regular sampled intervals), area sizes and types per area. Other formats can be generated from the Postscript output (PDF, raster) • Possibility to read temperature measurements directly from file and plot them on the map • Isotherm generation • Tailored to the needs of the Ice services around the Baltic Sea. • Runs on a Unix workstation (HP-Unix, Digital Unix, SUN Solaris, Linux) • Implemented using C++, X-Windows, Motif
FINNISHICE SERVICE:FLOW OF DATA AND INFORMATION PRODUCTS Sending to Receiving Format change ViewIce : NOAA ships & processing & compression Check AVHRR & adjust Geometric Sending to RADARSAT Down- transformation+ icebreakers SAR loading area cuts+ resolution ViewIce : reduction+ Check SST compression & adjust Users of all Ground Automatic kind: truth Automatic Classification - Classification -Icebreakers Call-fax Ice chart -Ships ECMWF -Pilots -Fishermen e-mail ICEMAP -Coast Line reduction guard HIRLAM -Military -Strategic Ice drift Ice drift in text transpor- Ice forecast chart format tation Wave & WAM planning WAM gauge -General Wave forecast data public charts Wave forecasts in text Formats: *. pdf , *.ice , *.tiff , *. postcript , *.grid, Output product Server Model Processes Interactive operations on In flow Model Manual computer operation
IceMap status today • Development mainly in Linux, latest version 3.2. This version used as a tool in research projects (IRIS: Ice Ridging Information for Decision Making in Shipping Operations) • Versions in operational use : • FIMR: HP, ver 3.1.2.3 • BSH: Sun Solaris 7, ver 3.0.3 • SMHI. Digital Unix, ver 2.8.4 • Windows version prototyped
ICEMAP recent additions and future enhancement ideas • Possibility to run IceMap in batch-mode. Enables automated production of charts for separate areas and in different formats (including grid-files). Used at FIMR Ice Service. • Automatic coloring of charts according to ice polygon attributes using color standard guidelines. Experimental at this stage • Additional attributes for the ice polygons related to ice ridging. Enables dynamic addition of new attributes. • Line simplification to reduce size of output file. Useful for possible transfer of vector formats over slow links or for resolution reduction for other purposes. • Windows version (requires Cygwin license) • Output according to SIGRID-3 (if required, implementation not there yet)
IceMap on Linux - licensing options • Linux-version is prototyped in a research project (IRIS). Prototype will be made available to participants in the IRIS project (FIMR, SMHI) • Licensing option including source code access may be offered to anybody interested. Enables development of enhancements and in-house support without dependency on VTT. Terms and conditions available on request. • copy of corrections/improvements also sent back to VTT • for use within own organization only
IBNet – the End User System on the icebreakers • Traffic information system for icebreakers • Contract assignment by the Finnish and Swedish Maritime Authorities (jointly) • Now in operational use in 2 centers + 20 nodes, about 50 client installations, 24/7 utilization in wintertime. • During a season over 200 Mbytes of data is generated in one replicated database (excluding satellite image data) • Utilization of satellite images essential
IBNet geographically VSAT satellite connection to the ”big” icebreakers , up to 512 kbit/s
IBNet main modules • Input on one IBNet node, on an icebreaker for example, is automaticaly replicated, i.e transferred to the other IBNet nodes. • Certain operations can only be input by the IBNet Operator, such as ice restrictions for ports, ship register information etc.
Shipowner’s Shipowner’s Office Office Satellite Data flow in the Baltic Sea Data Provider Server Client Software Clientsoftware Dataprovider Server -Image preprocessing and geocoding -Compression 1.1 km pixel, visible and infrared Icebreakers FMA, FMA, NOAA satellites SMA SMA FMI Ice services (FIMR, SMHI) NOAA weather satellite images - Image delivery - Icemaps KSAT RADARSAT 30 - 100 m pixel, all weather Merchant ships FMI = Finnish Meteorological Institute IBPlott SMHI = Swedish Meteorological and Hydrological Possible link Institute FIMR= Finnish Institute for Marine research ViewIce FMA = Finnish Maritime Administration Mobile link SMA= Swedish Maritime Adminstration KSAT= Kongsberg Satellite Service AS
IBPlott • Satellite images • NOAA and RADARSAT, now also ENVISAT • Traffic situation • Both icebreakers and ships • DirWays • Icechart • Weather forecast and observations
ViewIce (= IBPlott for merchant ships) • Functionality as in IBPlott, but no traffic situation information • Ice charts • Satellite images • Weather prognosis • Wave forecasts
Data provider n Data provider 1 General data flow from providers to ViewIce Data files Data file Pre-existing data transfer system (e.g. AMOS mail) Data file ... ViewIce Data file Classified images and ice charts Wind, pressure, water level observations Wind, pressure forecast NOAA images Text forecasts Wave forecasts Radarsat images
VTT focus in the future • Distribution and delivery aspects • the Facade • delivery tailored to customer capabilities and needs • Architecture of distributed systems • interoperability • open systems • (Archive) • internally • externally • And: VTT sees no reason why IceMap could not have a central role in the Ice Services still for many years to come.
Additional information • www.vtt.fi/tte/pub/tte1/viewice/ • Robin.berglund@vtt.fi • Ville.kotovirta@vtt.fi • Markku.kylanpaa@vtt.fi (IceMap)