Download

1 / 14
150 likes | 281 Vues
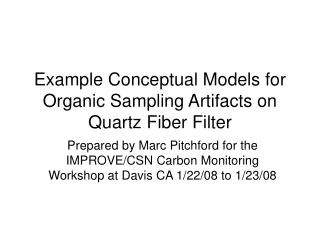
Example Conceptual Models for Organic Sampling Artifacts on Quartz Fiber Filter. Prepared by Marc Pitchford for the IMPROVE/CSN Carbon Monitoring Workshop at Davis CA 1/22/08 to 1/23/08. Organic Artifact Conceptual Model. What is it and why do we want it?

E N D
Example Conceptual Models for Organic Sampling Artifacts on Quartz Fiber Filter Prepared by Marc Pitchford for the IMPROVE/CSN Carbon Monitoring Workshop at Davis CA 1/22/08 to 1/23/08
Organic Artifact Conceptual Model • What is it and why do we want it? • Hypothesis-based, testable description of the artifact process that is consistent with available information • Framework for organizing available artifact information and identifying missing information • Can be used to evaluate the reasonableness of proposed artifact adjustment approaches
Example Organic Artifact Conceptual Model • Definitions • Volatile Organic Compounds (VOC) - gaseous under all typical ambient conditions • Non-Volatile Organic Compounds (NVOC) - particulate under all typical ambient conditions • Semi-Volatile Organic Compounds (SVOC) – gaseous or particulate depending on ambient conditions (T, p, RH, etc.) • Artifacts are caused by phase changes of SVOC occurring between the atmosphere and the end of sampling [hypothesis associated with this definition]. • Primary or front filter is the first filter in a sampler and the only one that should have particle capture • Secondary or backup filter is in series with and following the primary filter it should only experience gases • QBQ refers to a Quartz filter Behind another Quartz filter • QBT refers to a Quartz filter Behind a Teflon filter • Field blank filter is passively exposed to the sampled atmosphere but doesn’t have are flow through it
Example Organic Artifact Conceptual Model • Hypotheses: • Pre-fired quartz fiber filters capture some fraction of the gaseous SVOC (positive artifact) • Fractional capture depends on the SVOC characteristics, filter characteristics, temperature, pressure, etc. • Filters from the same manufacturers batch have similar (but not identical) SVOC capture efficiency • Filter capture of SVOC reaches saturation at some point after which no additional or little additional SVOC is captured • Particulate SVOC can evaporate from the top of a quartz filter during sampling (negative artifact) and are then no different from the gaseous SVOC that can be captured as described above • Teflon filters do not capture gaseous SVOC so are only subject to negative artifacts • VOC are always gaseous and NVOC are always particulate so neither contribute to artifacts so don’t need to be accounted for in a conceptual model
Alternate Example Organic Artifact Conceptual Model [Warren White’s Contribution] • Hypotheses: • Pre-fired quartz fiber filters capture some VOC species (positive artifact) • Firing creates molecular-scale features that serve as chemical receptors for complementary structures in some gas molecules. • These receptors are finite in number, so saturation can occur. The absence of active flow may confine saturation in the field blank to the surface layer. • The number of carbons captured by a given receptor depends on the gas molecule, so the same filter can saturate with different amounts of positive OC artifact on different days. • Liquid NVOC can be lost from a quartz or Teflon front filter during sampling (negative artifact). The fibers of the quartz backup act on the surface tension of the NVOC to ‘wick’ material from the front to back filter. The resulting negative artifact is itself an artifact of using the backup filter – the support screen behind a single filter produces no such wicking! • The SVOC mechanisms described on the previous slide can contribute additional artifacts, but are not required to account for the observed differences between backups and field blanks.
Schematic of an example organic artifact conceptual model • Qualitatively depicts negative artifacts (i.e. SVOC particle evaporation and capture) and positive artifacts (i.e. SVOC gas capture) • Qualitatively depicts the differences between efficiently and inefficiently captured SVOC After Sampling (SVOC distributed on filters) Negative artifact Positive artifact Atmosphere Front Filter Backup Filter To the pump Field Blank Before Sampling (no SVOC on filter) Particles Gases Particle and gaseous SVOC that are efficiently captured by quartz. Particle and gaseous SVOC that are inefficiently captured by quartz. Schematic prepared as though the quartz filters have not reached SVOC saturation.
Front and backup filters cannot be used to distinguish between positive and negative artifacts Negative artifact shouldn’t show up on the field blank Inefficiently captured SVOC on the backup and field blank are about the same as the positive or negative artifact on the front filter, but not so for the effectively captured SVOC This conceptual model is not consistent with the data because backup filters have the same or more SVOC than field blanks After Sampling (SVOC distributed on filters) Negative artifact Positive artifact Atmosphere Front Filter Backup Filter To the pump Field Blank What can we learn from this pre- saturation conceptual model?
Color Schematic – After Sampling Negative artifact Positive artifact Atmosphere Front Filter 100 P SVOC90 100 P SVOC10 100 G SVOC10 100 G SVOC90 Backup Filter 90 10 10 90 To the pump 9 9 9 9 Field Blank 1 81 81 1 0 0 10 90 Change from Color to Numeric Schematic Diagrams • A quantitative schematic permits us to readily see smaller changes and to make calculations • To implement it we need to assume the atmospheric concentration of SVOC particles and gases (e.g. 100 arbitrary units) and to arbitrarily define efficient and inefficient capture (e.g. 90% & 10%) Numeric Schematic – After Sampling Particles – Negative Artifact Gaseous – Positive Artifact
Comb. #2 Comb. #1 100 P SVOC10 100 G SVOC10 100 P SVOC90 100 G SVOC10 100 P SVOC90 100 P SVOC10 100 G SVOC90 100 G SVOC10 20 100 90 10 90 10 18 18 9 9 9 9 162 1 82 81 1 81 10 10 0 0 10 90 More From the Numerical Schematic • Any combination of efficiently or inefficiently captured VOC particles and gases can be simulated by combining information in the rows that represent the individual components and following the conceptual model rules • Various artifact adjustment methods can be compared to the true SVOC particle concentrations (e.g. true particle SVOC is 100 units for both example combinations shown below, but adding and/or subtracting the backup and field blank do not adequately adjust for the artifacts)
Comb. #2 Comb. #1 100 P SVOC10 100 G SVOC10 100 P SVOC90 100 G SVOC10 100 P SVOC10 100 G SVOC90 100 G SVOC10 100 P SVOC90 5 5 5 5 5 5 5 5 5 5 5 5 190 190 90 90 90 90 5 5 0 5 5 0 Adding Simple Saturation to the Conceptual Model Schematic • Let’s assume that the quarts filters are saturated at SVOC concentrations much below what they experience during sampling (e.g. saturated at 5 units of SVOC) • The saturation assumption makes adjustment for the positive artifact trivial (i.e. in this example subtract 5 units from either the backup or field blank), but doesn’t allow any adjustment for a negative artifact. • This conceptual model is inconsistent with the data that have the same or higher concentrations of SVOC on the backup filter compared to the field blank filter.
100 P SVOC90 100 P SVOC10 9.75 9.75 9.26 9.26 81 81 0 0 More Complex Saturation Conceptual Model • To better match the data, assume that saturation slows but does not stop the capture of SVOC on quartz (e.g. as illustrated below after saturation at 5 units SVOC capture is reduced to 5%) • This has the desired effect of having higher concentrations on the backup filter compared to the field blank for the composite (or anytime there’s particle SVOC) and has similar values on both backup and field blanks when only gaseous SVOC are involved (i.e. positive artifact) • The field blank concentration is a good adjustment for the positive artifact • Now the difference between the backup and field blank shows that there is a negative artifact, but to correct for it you’d need knowledge of how quartz filters capture SVOC (i.e. in this example that collection is efficient up to 5 units then efficiency drops to 5%). Comb. #1 Comb. #2 100 G SVOC90 100 G SVOC10 100 P SVOC90 100 G SVOC10 100 P SVOC10 100 G SVOC10 9.75 9.75 14.75 14.75 9.26 9.26 14.01 14.01 171.24 171.24 81 81 9.75 9.75 9.75 9.75
Other configurations that can be simulated • The same numeric schematic display can be used to depict QBT and denuder/QBQ sampling systems • QBT example is for 100 units of particle and of gaseous SVOC with the 5 unit saturation followed by 5% efficiency for the quartz • Denuder example is for 100 units of particle and of gaseous SVOC and assumes the denuder has a 95% efficiency up to 50 units then it drops to a 50% efficiency, and quartz efficiency as described above Denuder - QBQ Combination 100 P SVOC10 100 G SVOC10 100 P SVOC10 100 G SVOC10 Quartz behind Teflon Combination 100 P SVOC10 100 G SVOC10 100 P SVOC10 100 G SVOC10 72.5 0 72.5 0 0 0 9.75 2.75 11.13 9.75 9.75 14.75 9.26 2.48 10.57 185.25 90.25 90.25 81 22.27 105.8 0 9.75 9.75 0 9.75 9.75
Topics for the Group Discussion • Fundamental questions • Do we want the artifact adjustment to estimate the PM in the atmosphere or on the Teflon filter? Is the answer the same for both IMPROVE and CSN? • Is it better to have the same artifact adjustment process for both programs, even if different approaches might give better estimates of the true PM? • How much effort (time & funds) are we willing to utilize to attempt to improve our artifact adjustment approach? • How much additional sampling and analysis are we able to routinely do in order to have the information needed to implement an improved organic artifact adjustment? • Needed information for a better understanding of quartz filter uptake of SVOC under varying typical conditions • What are the capture characteristics (e.g. the rate of capture as a function of loading, type of SVOC, T, RH, etc.)? • How similar are the capture characteristics among quartz filters in the same batch? This may limit the success of artifact adjustments. • Are SVOC from particles in the atmosphere (negative artifact) captured with similar efficiency to SVOC gases (positive artifact)? • Are there geographic (regional and urban vs. remote) as well as seasonal patterns, and do they have similar seasonal patterns of SVOC concentration?
Topics for the Group Discussion • Technical approaches for gaining the needed information • Utilize existing information – extract and organize applicable information from the published and grey literature [DRI reports have already begun this process, what more is needed?] • Sponsor special studies that specifically address important information gaps • Modify IMPROVE & CSN routine monitoring to collect additional data at some or all sites as needed to address important information gaps • Approaches to organize, plan and implement the additional work [one purpose of this workshop] • Determine the scope of the work (both the needs and the likely resources) • Develop and priority order a list of desired activities • Identify responsible individuals and organizations to sponsor and conduct the work • Establish a schedule to gather and integrate the new information