Download
1 / 38
390 likes | 837 Vues
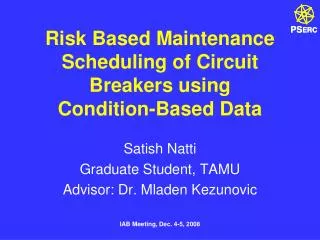
Using PI for Back Testing Usage-Based and Condition-Based Maintenance Strategies Prior to Deployment in Asset Management. Gopal GopalKrishnan, P.E. OSIsoft, Inc. Larry Hruby Basin Electric.

E N D
Using PI for Back Testing Usage-Based and Condition-Based Maintenance Strategies Prior to Deployment in Asset Management Gopal GopalKrishnan, P.E. OSIsoft, Inc. Larry Hruby Basin Electric Mark BlaszkiewiczSebastien Cournoyer, CMRP DTE Energy
Agenda About Basin Electric, About DTE Energy History of PI System at Basin Electric and DTE Energy History of maintenance systems: Basin has Ventyx AssetSuite (aka Indus Passport) DTE has IBM Maximo Case studies for back-testing: Usage-based strategies Condition-based strategies Q & A Sebastien Cournoyer, CMRP DTE Energy
What You Can Expect Talk is not product specific – use several tools available in the PI Infrastructure Start with maintenance tasks and work backward to see if data exists in operations history that can be used Collect additional equipment inspection data for proactive maintenance Use PI tools and in-house resources in small increments without new capital outlay
Coal-fired Power Plant http://en.wikipedia.org/wiki/Fossil_fuel_power_plant
Basin Electric Power Cooperative • HQ – Bismarck, North Dakota, wholesale provider (generation and transmission) of power to 126 Rural Electric Systems covering portions of 9 states • Operate coal, wind, gas, oil based power generating facilities and a synthetic natural gas production facility • Capacity • 3623 MW (Base load) • 405 MW (Peaking – CTs) • 136 MW (Wind)
Basin - Leland Olds Station (LOS) Fuel: Lignite with PRB (Powder River Basin) blending Unit 1: 220 MW - 1966 Pulverized Coal Boiler (Babcock & Wilcox) Turbine, GE DCS, Emerson Ovation 2007 upgrade Unit 2: 440 MW - 1975 Cyclone boiler (Babcock & Wilcox) Turbine, Alstom DCS, Emerson Ovation 2006 upgrade Under Construction: Limestone Scrubbers for SO2 capture ($410MM capital project) Leland Olds, Stanton, North Dakota
Leland Olds Station (LOS)– Software Infrastructure OSIsoft PI (piloted in 2005) 20,000 tags Emerson Ovation DCS, Rockwell PLCs, GE relays Ventyx Asset Suite (previously Indus Passport) Started using in 1998 as Passport, has evolved into Asset Suite in 2008 Used for Work Management, PM’s, Inventory, Equipment spec’s & history, Purchasing, Contracts
Leland Olds – Maintenance Initiatives Working toward condition based maintenance (CBM) for years Vibration, oil analysis, thermography etc. Investigated Rockwell and OSI PI as platform to feed CBM and operational data to AssetSuite PI data reviewed: Standard PM work orders usage based Machine status work order management Sensor drift and calibration Control Loop Health Condition-based notification
DTE Energy – Detroit Edison Detroit Edison • Michigan’s largest electric utility with 2.2 million customers • Over 11,000 MW of power generation from 7 plants - mostly coal fired • 54,000 GWh in electric sales • $4.7 billion in revenue DTE Energy - Detroit Edison
DTE - Plants and Performance Center Monroe – 3,135 mw Belle River – 1,260 mw Harbor Beach – 103 mw Trenton Channel - 730 mw Performance Center – 11,588 mw St Clair – 1,417 mw Fermi – 1,100 mw River Rouge - 527 mw Greenwood – 785 mw
DTE – History of PI and Maximo PI is a key infrastructure and technology enabler for real-time operations data as part of the “Enterprise Business System” at DTE Additional details from a Nov. 2008 presentation at: www.osisoft.com/osisoft/downloads/Regional_Seminars/Detroit/DTE%20Energy%20(John%20Kapron).pps IBM-Maximo is a key application for work management as part of the “Enterprise Business System” at DTE Additional details at: http://www-03.ibm.com/press/us/en/pressrelease/21649.wss
DTE – Details of PI usage In use since 1998 – started with a pilot at Monroe in 1998 Enterprise Agreement for corporate wide use PI is an infrastructure product – magnitude of use and functionality is expanding Success!
DTE - Total FleetManagement Drives Performance Excellence Process Costs Asset Health Operational Performance Market Value Fleet Optimization Financials Work Management Market Expert Systems SME Status Displays MISO, Fuel Coat Framework Unit Capacity Framework SAP Maximo Real-time Process Applications WEB Portal Applications Distributed Control Systems (DCS) Distributed PI Historians
DTE - Control & Technology Framework Fleet Optimization Process Costs Asset Health, Market Value Drives Performance Excellence Fleet Optimization Process Costs, Asset Health, Reliability Operational Performance, Market Value Actionable Information – KPI’s 15% Relate all Data Sources ProcessNet Framework (PI, ProcessGuard, Maximo, SAP, UCF, P3M, Predictive Monitoring, NeuCo, LIMS, Plant View ..) Business Intelligence Outage & De-rate (UCF) Maintenance & Market 25% Advanced Analysis & Process Optimization Reliability Academy Equipment, Process, Performance, Reliability Models Closed Loop Process Optimization Expert Systems Predictive Monitoring, Optimization MBO/PdM/Risk Assessment 60% System Dashboards Fleet Status Assessment Fleet Drill down Subject Matter Experts 90% WEB Visualizing Plant Alarm, DCS Real-time WEB Graphics Easy Access to Information Standard User Interface WEB Visualization 100% Process Discrete Data Engineering Applications RFID, PMAX, DFTS, eNote, Fuel Cost Framework, Alarm Management Engineering Applications PMAX, Digital Fuel Tracking, Fuel Cost Framework Process Discrete Data Discrete data Limited value 90% Post Event Analysis DCS, PLC & PI Distributed Control Systems (DCS) Distributed OSIsoft PI Historians Large Population of Data 90% People Making right decisions when it matters! Fossil Generation Business Unit Strategy ABB % Complete
Link Operations and Maintenance Business goals Usage based maintenance (UBM) strategies Mostly, data is already in PI Condition-based maintenance (CBM) strategies When relevant data not in PI, collect equipment inspection specifically designed to drive maintenance benefits Business justification Calendar-based maintenance strategy := Amount of maintenance will be same as last year UBM and CBM:= Opportunities for savings Use PI history and Maintenance history to: Back-test calendar based PM for conversion to UBM Back-test corrective work order (CM) events for conversion to CBM
Usage-based Criteria Run-hours - Coal feed conveyor Pulverizer High pressure service water pumps Run-modes - number of starts, number of trips – Peaker CT blades Run-weight - tonnage processed (mining industry), flow-rate (time-integral) converted to volume • PI totalizer • PI time-filtered conditional expressions (time-weighted and event-weighted)
Service Water Pump – Usage Based Pumps were off for extended period, however the PM WO still went out - 28 PM hours
Fuel Conditioner – Usage Based Equipment runs about 80% of total year; usage based maintenance can save 152 PM hours
Coal Conveyor - Usage Based Maintenance: 60 PM hours per conveyor per year; 22 conveyors per site, 6 sites Actual runhours: 25% based on PI data, implies a 75% savings Projected savings: 900+ PM hours (approx. $45,000 at $50/hr) per year per site
Pulverizer - Usage Based Maintenance: 160 PM hours per pulverizer per year; 16 pulverizers per site, 6 sites Actual runhours: 80% based on PI data, implies a 20% savings Projected savings: 480+ PM hours (approx. $25,000 at $50/hr) per year per site
Condition-based Criteria Equipment failure is known to be correlated to a slowly degrading metric that can be monitored Temperature (Motor windings, Bearing) Pressure or DeltaP (heat-exchanger plugging, filters) Vibration – Amplitude, FFT etc. ; Also interpret along with operations data in PI Instrument and transmitter calibration Control loop health
Secondary Air Heater Plugging Air heater tube plugging causes DeltaP (green line) to increase over several months and is a trigger for maintenance
Boiler (convection section) Tubes - Plugging Rapid rate of change of Delta P over several days is a trigger for maintenance
Steam Condenser Fouling Steam condenser fouling causes condenser pressure to rise (blue line), note the rapid rise in a matter of few days. Threshold is 4 inHg. Green line shows the inlet water temperature which is relatively constant
Vibration – Conveyor Motor - Note the rapid rise in vibration amplitude in Jan. and Feb.; also shown in the trend. - Resolved by a shaft re-alignment – see next slide
Vibration – Conveyor Motor Shaft realignment resolves the vibration issue
Instrument Drift – O2 Analyzer – U2-E Based on redundant dual sensors
Transmitter Drift Boiler feedwater pump discharge pressure Based on redundant triple transmitters (PressA, PressB and PressC) XY Plot, PressA (X) vs. PressB (Y1), PressC(Y2) Good Not Good
Transmitter Drift – U1 – Spray Flow Green – Delta between the transmitters Blue – Unit 1 is at about 220 MW
Firing Rate Control Loop – Boiler Exit O2 O2 set point: Approx. 3.2% Actual process value (green line): Varies from 1% to 5.5%
Firing Rate Control Loop – See Notes At purple crosshair, air (red) peaks when coal (yellow) dips causing O2 (green) to peak after 30-40 secs. At white crosshair, air (red) dips when coal (yellow) peaks causing O2 (green) to fall below 1% after a lag of 30-40secs, and so on….
Manual Inputs – Operator Rounds in PI Equipment inspection data collection specifically designed to help maintenance tasks (data not already in PI) Benefits: Proactive maintenance for increased MTBF (mean-time-between-failure) Source: www.aeec.com/conveyor/Belt_Cleaners/Vplow.aspx (retrieved Jan 2009) Operator Rounds: V-PLOW status on a coal conveyor belt
Breaker Inspection Sheet Equipment inspection data specifically designed to help with maintenance tasks (data not already in PI) Data collection includes numeric values such as resistance, clearance etc.
Breaker inspection – 80 attributes per breaker, 1000 breakers – annual inspection or after a trip Dust Collector Screw conveyor Electric motor Reducer Bearings Transfer point / chute liner condition Limit-torque actuator Hydraulic cylinder, Pneumatic cylinder Pumps Mechanical seals Conveyor skirting Conveyor scraper, primary and secondary Idler, roll assembly Pulley Lube system Coupling Torque coupling Valve Piping Manual Inputs – Operator Rounds in PI Equipment inspection data specifically designed to help with maintenance tasks (data not already in PI) Everything we visually inspect, measure or observe can be recorded in PI to track, trend and monitor
Findings Operations history and maintenance history can validate and quantify benefits for usage-based criteria prior to deployment Use manual input data (Manual Logger) to supplement condition-based strategies Review control loops, including the instruments, transmitters and calibrations Vibration data – combine with equipment operating conditions for better diagnostics
Enterprise Gateway SOA (service oriented architecture) to exchange information between the PI System and any external system via web services.
Thank you www.osisoft.com