Download
1 / 23
230 likes | 475 Vues
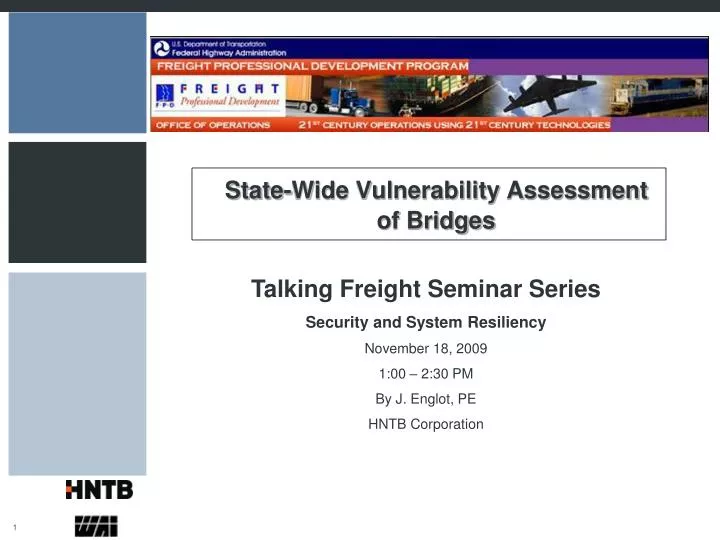
State-Wide Vulnerability Assessment of Bridges. Talking Freight Seminar Series Security and System Resiliency November 18, 2009 1:00 – 2:30 PM By J. Englot, PE HNTB Corporation. Review how the state’s bridge inventory list (6,600+ bridges) was previously reduced and prioritized

E N D
State-Wide Vulnerability Assessment of Bridges Talking Freight Seminar Series Security and System Resiliency November 18, 2009 1:00 – 2:30 PM By J. Englot, PE HNTB Corporation
Review how the state’s bridge inventory list (6,600+ bridges) was previously reduced and prioritized • Update the ranking methodology to create a “Top 50” list of bridge and tunnel assets for the state • Include critical rail (passenger & freight) and highway bridges and tunnels • Include any other adjacent critical or hazardous infrastructure in the assessment • Conduct assessment of threats/hazards, vulnerability, impact and countermeasure needs for top 50 assets • Submit findings in a report for general countermeasures for all highways, bridges, and tunnels Scope of Project
Multi-hazard Extreme Events Extreme Events • Seismic • Vessel Collision • Wind (Long Span Bridges) • Hydrocarbon Fire • Terrorist Attack (Man-Made) • Vehicular Impact • Scour and Flooding Extreme Events for Bridges
Bridges – Progressive / Disproportionate Collapse History I 90 Bridge at Schoharie Creek (1987) (Scour) Silver Bridge (1967) (fracture) Mianus River (1983) (fracture) Example:Progressive Collapse Bridges SFOBB –East Bay Spans (1989) (Seismic) Queen Isabella Causeway (2001) (barge collision) I 35 Minneapolis (2007) (fracture)
Rail Bridge Collapse – Flooding/Scour Example:Progressive Collapse Bridges • Amtrak Bridge Collapse Mobile Alabama September 22, 1993 • 1993 Great Midwest Floods washed away several railway bridges
Limited Criteria to a Transportation Focus in the Screening Phase • Ability to Provide Protection • Relative Vulnerability to Attack • Casualty Risk (ADT & Bridge Length) • Environmental Impact (utilities) • Replacement Cost • Replacement Down Time • Emergency Response Function • Government Continuity • Military Importance • Available Alternate (detour length) • Communication Dependency (utilities) • Economic Impact (ADT) • Functional Importance (ADT) • Symbolic Importance (Historical) Previous Screening and Ranking Criteria
Development of New Screening Criteria • Goal is to independently develop criteria using latest DHS guidance (NIPP) and compare to previous results • Bridge criticality should be related to the state’s mission and the DHS mission for transportation sector • Align with DHS goal of “Resiliency of Critical Transportation Infrastructure” • Include priority for emergency evacuation routes • Develop a metric to fairly compare criticality of highway and rail passenger/freight bridges and tunnels • Relate criticality to economic impact on region New Screening Criteria
Summary - Screening to determine “Top 50” facilities • Criteria • Hazard independent • Casualties not included • Assumptions • Complete Collapse of Span • Based on volume of goods and people transported • Based on Structural Inventory and Appraisal (SI&A) data • Rank all 6,000+ facilities • Formula based on: • Max. Span Length • No. Spans • No. Lanes • County • Detour Length • Average Daily Traffic (ADT) • Average Daily Truck Traffic (ADTT) Modified Screening Method
Multi-modal Aspects • Develop a unit for measuring movement (throughput) of people and goods independent of mode (highway or rail) • Utilize the wealth of technical references and traffic studies on the economic impact of traffic delays to the regional economy • Perform a reality check on the results: Verify that people have redundant multi-mode travel paths Verify that freight has redundant multi-mode travel paths Multi-modal Aspects
Equivalent Units of Transport Multi-modal Aspects
Transport unit: • 1 automobile (1.2 avg. pass.) = 1 Transport Unit • 1 truck = 2 Transport Units • 1 railroad passenger = 0.83 Transport Units • 1 rail hopper car = 4 trucks = 8 Transport Units • 1 cargo container = 1 truck = 2 Transport Units Modified Screening Method
Screening Formula PDTU = [TVTU × DD × TDD] × ER Where: PDTU = Potential delay of transport units (in unit-hours). TVTU = Total volume of transport units (in units/day). DD = Days of downtime when bridge or tunnel is not functional (in days). TDD = Time delay due to detour (in hours) ER = Importance factor for bridges that are designated evacuation routes. This is a multiplier (e.g., 1.2) to increase the importance of those facilities that are intended for use during emergencies. Modified Screening Method
Screening Formula Recovery time of bridge based upon maximum span length: DD = Max Span Length Factor Max Span Length Factor (measured in months) DD(months) = 7.0E-6(Lmax)2 + 0.0168(Lmax) Based on construction time of recent bridges, best fit Oakland MacArthur Maze < 100 feet 1 month Interpolate between 100-500 feet 6 months (315 ft.) Interpolate between 500-1,500 feet 24 months (1,000 ft.) Tacoma Narrows Bridge > 1,500 feet 42 months Modified Screening Method
Rail Information NJ Transit, Amtrak, and CSX, Norfork Southern, and the Short lines • Owner • Line • Structure Number or ID • Name of Structure • County • Township • Overall length of structure • Maximum Span • Number of Tracks on structure • Avg. daily number of passengers carried • Avg. daily number of freight cars Note: Limit data to most heavily traveled lines. Modified Screening Method
Freight Rail Bridge Data Freight Rail Bridge Data Top 50 with Rail Bridges • Sources of Information for Freight Rail Volumes • FRA data is most reliable if available • Rail freight studies published by State DOT, regional Authorities, and MPOs • State-wide freight study showing freight rail density
Key Freight Rail Bridges Freight Rail Bridge Data Top 50 with Rail Bridges Multi-Arch Bridge (Freight & Passenger) Multi-Truss Bridge (Freight) • Key Freight Rail Bridges • 15-25 avg. daily trains • Average train length 61 rail cars • Have long detours (10 – 55 miles) • Have long spans (90 - 330 feet) • Passenger trains increase criticality Swing Bridge (Freight & Passenger)
Top 50 Results of Screening of Bridges and Tunnels for All Public Agencies Top 50 with Rail Bridges
Top 50 Results of Screening of State-Owned Bridges Top 50 with Rail Bridges
Steps For Detailed Vulnerability Assessment and Extrapolation • Complete Threat Analysis • Complete 7 representative TVA Risk Assessments • Identify and estimate preliminary mitigations • Extrapolate TVA and mitigations from 7 representative bridges to all 50 state owned bridges • Summarize findings in a report for general countermeasures for top 50 critical bridges and tunnels Threat and Vulnerability Assessment
Top 50 Bridges Sorted by Type and Feature Crossed • Bridge Structure Types IdentifiedNo.Longest Span in Group • (02) Stringer/Multi-beam or Girder 37 • Longest main span over water (252 ft. span) • Longest main span over land (230 ft. span) • (03) Girder and Floorbeam System 5 • Longest main span over water (150 ft. span) • Longest main span over land (161 ft. span) • (09) Truss – Deck 2 • Longest main span over water (550 ft. span) • (11) Arch – Deck 1 • Longest main span over water (96 ft. span) • (15) Movable – Lift 3 • Longest main span over water (333 ft. span) • (16) Movable – Bascule 2 • Longest main span over water (185 ft. span) Threat and Vulnerability Assessment
Typical Mitigations to Reduce Multi-hazard Risk Typical Mitigations
Results of State-Wide Assessment • Criticality of Every Highway and Rail Bridges as part of the State Transportation System is Known • Use as Tool for Prioritizing Investing of Funds for Security, State-of-Good-Repair, and Rehabilitation • “Risk Based” Assessment for DHS/TSA Federal Funding Purposes • Use as Tool for Planning New Crossings to Increase Transportation Network Resiliency • Use to Perform Detailed Vulnerability Assessment of Grouped Assets • Use to Develop Security/Hazard Mitigation Budget and the Order of Priority for Spending Funds Results