Download
1 / 75
760 likes | 1.23k Vues
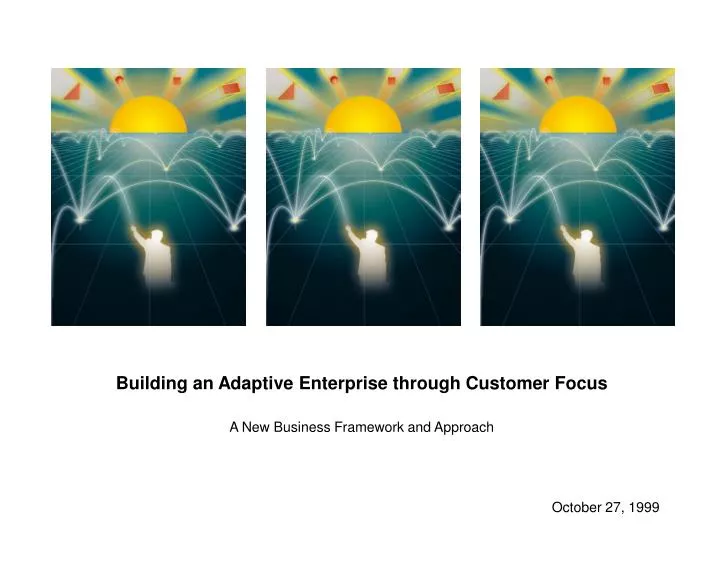
Building an Adaptive Enterprise through Customer Focus A New Business Framework and Approach. October 27, 1999 . Contents. I. The Sears Story II. Business Imperatives in the Connected Society III. The New Business Paradigm IV. Gap Analysis V. Actions and Implementation Plan

E N D
Building an Adaptive Enterprise through Customer Focus A New Business Framework and Approach October 27, 1999
Contents I. The Sears Story II. Business Imperatives in the Connected Society III. The New Business Paradigm IV. Gap Analysis V. Actions and Implementation Plan VI. Key Success Factors
The Sears Transformation Story Provides a Valuable Lesson for Samsung Industry Sears ? Sears Sears & Industry Sears 1992 1997 2000 1945 1982 1886 Birth Growth Leadership Inflection Point Transformation Continuous Renewal • Founded in 1886, it essentially starting the retail concept of large department stores with a full line of merchandise and catalog business • Core competencies: its adaptive ability to understand and serve changing consumer needs • Grew rapidly reaching $1B in sales in 1945 and $41B by 1985 • Became the dominant U.S. department store • Created “brand power” • Became too inward-focused, self-absorbed • Began diversifiying • Centralized and bureaucratic policies • Ignoring new breed of competitors • Results: Losing market share, financial performance declining, shareholder losing confidence • Brought in a new CEO • Embarked on a turnaround program : • focus on core business • customer focus • greater local market focus • improved cost structure and productivity • organizational and cultural renewal • Despite huge success, continue to renew and adapt to changing environment, e.g., the connected economy • Continue to finetune its customer focus • Continue to refine its value proposition and go-to-market strategies
Sears Defined the American Retail Industry • First broad scope retailer offering products not readily available to the general public • Set the “Gold standard” of retailing in US, offering unheard of money-back guarantees and free trial offers • Grew rapidly reaching $1B in sales in 1945 ($9B in 1998 dollars) and $41B by 1985 ($63B in 1998 dollars) • One in five Americans shopped at Sears regularly • Employees were extremely loyal, and were rewarded with the best profit-sharing programs in the country • Created the catalog industry in US • Undercut profit margin of the “general store” to save money for consumers • Created “Brand Power” -- Sears became a household name standing for high quality at a fair price • Sears developed popular private label brand names including Kenmore appliances, Craftsman Tools and Diehard batteries Retailer Catalog Brand “Sears is the paragon of retailers. It is number one, in the United States, and number two, three, four and five” - Fortune Magazine, 1960s Source: Company web site, Hoovers, HBR Sears, Roebuck and Co. Stanford Business School Case, 1997, EY Analysis
Success Has Made Sears Complacent, However, and it Grew Out of Touch with the Changing Retail Marketplace Customer-distant decision making • Headquarters controlled stores, yet did not work closely enough with them to understand their environment • Bulletins were written about every process--employees were not allowed to make any decisions Distracted • Owned a conglomerate of unrelated companies including Allstate Insurance, Dean Witter Investments, Coldwell Banker Real Estate & Discover Credit Card Ignored true competition • Sears was stuck in the past -- they did not catch on to emerging retailing trends • Did not see Wal*Mart & K-Mart entering into their retail space • Considered only JC Penney & Montgomery Wards as its competitors Misjudged target customers • Thought its target customers were male • Targeted advertising and promotions towards men Ineffective performance management • Employee compensation did not align with corporate objectives Confused positioning • Unfocused response to new competition left Sears with an undefined strategy -- it was not a discounter (e.g., Wal*Mart) or a high end department store (e.g., Nordstrom) • “We didn’t know if we wanted to be a discounter, a department store, a specialty store or a mass merchant” - Arthur Martinez, CEO Source: Home Furnishings Network, 9/30/96, EY Analysis
Consequently, by the Early 90’s, Sears Had Lost Its Historically Dominant Position Profit Revenue Indexed Stock Price ($ Billions) ($ Billions) CAGR 89-92 42% 16%* 12% 6% 6% 2% CAGR 89-92 29% -0.4% 4% 3% 10% CAGR 89-92 23% 43% -1% -2% N/A Wal-mart Wal-Mart Sears Wal-mart K-mart JC Penney Dayton-Hudson K-mart S&P Retail Index K-mart Sears JC Penney D-H Dayton-Hudson JC Penney Sears *S&P Retail Index CAGR from 1990-1992 Source: Dow Jones, Bloomberg In 1992, Sears Hired a New CEO, Arthur Martinez, To Turn Around the Company
Under Martinez, Sears Embarked on a Three-Phased Transformation Process Turnaround (1992) Transformation (1993-1997) Growth (Ongoing) • Hired a new CEO • Stabilized operations to stop losses • Refocused on core business • Created a new corporate vision • Determined target customer and designed value proposition • Launched new ad campaigns • Instituted a new performance measurement system • Implemented comprehensive corporate wide change management programs • Continue to refine value proposition and go-to-market strategies • Continue to improve transformation programs • Began a new renewal process incorporating new environment--ecommerce Began selling off non-retail businesses Executives’ “Phoenix Team” created Solidified mission & vision statements Began 360° reviewing process of all managers Began goal sharing program Granted incentives to all store-line managers Increased number of full line mall stores Began “Holistic Retailing” strategy to meet the needs of homeowners through a variety of retail & service formats Created Total Performance Indicator (TPI’s) to measure achievement of market focus strategy TPI measures became part of top 200 associates’ compensation Reorganized around its appliance, home & automotive business Integrated TPI measures into part of all manager’s above store level compensation Hired new employees from outside Sears & the industry Subsegmented market to target more specific ethnic customer segments (e.g., Hispanics) Simplified policy & reduced bureaucracy by introducing “Freedom & Obligations” Began “Learning Map” program to train all associates about the need and reason for transformation Committed to remodel stores & gain additional selling floor space Sears moved from downtown Chicago to suburban Hoffman Estates Formed Sears University to educate executives on business practices Closed 113 department stores & reduced workforce by 50,000 people Began new marketing campaign, “The Softer Side of Sears,” which was targeted at women Developed neighborhood furniture & hardware stores Identified target customer as a middle aged female Revenues declined 9% to $52b, net loss of $3.9 B Recruited new Senior Executive Committee Started e-Commerce through sears.com Began 100 days evaluation period Launch second revolution Closed catalog business Hired new CEO 1992 1993 1994 1995 1996 1997 Source: Harvard Business Review, Sears Roebuck & Co. Turnaround, 1998, Company Web Site, EY Analysis
Customer Financial Results Employees The Transformation Began With a New Vision: A Compelling Place to Shop, Work, and Invest Compelling Place to Shop Passion for the customer Loyal customers increase top line growth Satisfied employees influence the shopping experience 3 Cs and 3 Ps People add value Performance leadership Employees rewarded for performance Compelling Place to Work Compelling Place to Invest Source: EY Analysis
The Initial Vision Was Then Translated into Specific Objectives and Measures Financial Results Employees Customer • Environment for personal growth and development • Support for ideas and innovation • Empowered and involved teams and individuals • Great merchandise at great value • Excellent customer service from the best people • Fun place to shop • Customer loyalty • Revenue growth • Superior operating income growth • Efficient asset management • Productivity gains Objectives • Personal growth and development • Empowered teams • Customer needs met • Customer satisfaction • Customer retention • Revenue growth • Sales per square foot • Inventory turnover • Operating income margin • Return on assets Measures Source: EY Analysis
Sears Rediscovered Its Target Customer Discovery Before • Management perception of target customer: • Thought target customers were male • Targeted advertising and promotions towards males • Core customer: • female • middle class (annual income of $25,000 - $60,000/yr.) • middle age (24-54 yrs. old) • head of household • mostly mothers “We had a company run by guys who thought they were in the “dirty fingernails” business of autos and hardware. There was no singular view of Sears target customer.” - Arthur Martinez, CEO “This was a big discovery. Unless we made the store more attractive to her, we weren’t going to break out of the box we were in.” - Arthur Martinez, CEO Source: HBR Sears, Roebuck and Company Turnaround, 1998; EY Analysis
Sears Then Refined Its Value Proposition to Meet the New Target Customer Value Proposition + + Product/Services Image Relationship • Added new departments such as cosmetics and jewelry for women • Expanded apparel offerings • Increased national brand products • Improved underdeveloped sections such as petites • Increased customer wallet share by offering multiple types of services and products to target customer • Rolled out the “Softer Side of Sears” advertising campaign, targeting the female customer • Communicated that Sears is changing--it offers more merchandise than just appliances and hardware • Renovated fixtures and lighting to give a more classy appearance • Redesigned stores to provide a more contemporary environment • Expanded selling floor space in stores by redesigning back rooms • Increased touch points with customers by expanding stores into neighborhoods with hardware and furniture stores Source: HBR Sears, Roebuck and Company Turnaround, 1998; EY Analysis
Believing That Employees Are an Important Part of the New Strategy, Sears Invested Heavily in Employees Employees Help Improve Performance Match Compensation with Performance Communicate Strategy • Town Hall Meetings • Held sessions in which all employees met in small groups of around ten • Learned about the industry, Sears and why Sears needed to transform • Improved Employee Selection • Developed interview selection tools to help managers hire employees with the correct skill sets • Determined new skills and attitudes needed to realize the new vision and revised new hire profiles accordingly • Decision-making/Empowerment • Gave front-line employees more authority to act on their own discretion to provide more responsive service to customers • Improved Training • Opened Sears University to teach courses essential for the operation of the transformation • Courses available to managers and above • Decreased Bureaucracy • Decreased bureaucracy by eliminating cumbersome policies and replaced with broad guidelines called “Freedoms and Obligations” • Stock purchases • CEO was required to invest five times his salary in Sears stock, and executive board was expected to invest three times their salary • Top 200 managers had to purchase their salary in stock • Total Performance Indicators (TPIs) • Compensation based on TPIs initially rolled out to top 200 managers • Eventually all managers above store level had compensation based on TPIs • TPIs were broken down with 1/3 based on each of employee, customer & financials • Goal sharing • Associates given the opportunity to earn variable incentive pay based on customer satisfaction Source: HBR Employee-Customer Profit Chain, 1998 ; HBR Sears, Roebuck and Company Turnaround, 1998; EY Analysis
To Monitor Progress, Sears Developed a Comprehensive Performance Measurement System Measuring Rewarding • Defined a balanced portfolio of strategic objectives along three critical and complementary perspectives: employee, customer, and shareholder • Developed a cause-and-effect model of how those objectives influence each other • Made sure that the model included drivers of future growth (“leading indicators”) • Used that model to develop key measures (Total Performance Indicators - TPIs) so that measurement would influence behavior • Wherever possible, defined a quantitative metric for each TPI, and where possible, confirmed statistical correlations in the cause-and-effect change • Monitored progress against TPIs using individual and shared goals, and used the results to finetune the list of TPIs • Linked performances against TPIs to compensation, using both individual and group goals and incentives. Compensation was linked to non-financial as well as financial performance, and the three perspectives were given equal emphasis • Cascaded compensation link from top management (Phoenix team, then top 200 execs, then down through middle management above store level, and finally to management teams in the stores as the TPIs proved themselves). Goal sharing was tried on a test-basis to cascade compensation links to the salesperson level Source: EY Analysis
Sears’ New Performance Metrics Measured Impact of Employee and Customer Satisfaction on Financial Results Employee-Customer Profit Chain Legend Focus on Employees Focus on Customers Financial Results • Rectangles represent survey information • Ovals represent hard data • Shading represents measurements collected in the form of Sears total performance indicators • Solid arrows represent statistically established correlations • Dotted arrows represent hypothetical relationships Customer Recommend- ations Attitude about the job Service ----------- Helpfulness Return on assets Operating margin Revenue growth Employee behavior Customer Impression Attitude about the company Merchandise ------------ Value Employee retention Customer retention Example: DRIVES DRIVES 5 unit increase in employee attitude surveys 1.3 unit increase in customer impression surveys 0.5% unit increase in revenue growth Source: HBR Employee-Customer Profit Chain of Sears, 1998; HBR Sears Roebuck & Co. Turnaround, 1998; EY Analysis
This Intense Effort Has Dramatically Improved Results for Employees, Customers, and Investors Market Share Total Performance Indicators Employee Scores2 Share Price 1992 = 1 Sears Dayton Hudson Scores JC Penney S&P Retail Index Wal-mart K-mart
Despite Success, Sears Continues to Renew itself to Adapt to the Changing Environment, e.g., Connected Economy • Entered into e-Commerce • Launched Sears.com • Focusing on appliances first, then will expand into hardware & tools, lawn & garden, and consumer electronics • Sears aims to be the definitive online source for the homeowner • Reorganized Executive Office • Created a chief executive office composed of current CEO Martinez and two finance/merchandise specialists • Will allow Martinez to focus on full line store needs and reduce the number of people reporting to him • Increased Store Sovereignty • Shifting more control of stores from headquarters to the local stores, so they can better react to their customers’ individual needs • Altered Store Environment • Hired one of the country’s top fashion photographers to create displays and specialty shops within the department stores Source: Context Magazine The Cyberside of Sears, Sept/Oct 1999, Chicago Tribune 9/19/99, Crain’s Chicago Business 9/6/99, Dow Jones, EY Analysis
The Sears Story: Redefinition of Core Business Vision Strategy Customer Value Propositions Go-to-Market Strategy Communication Communication Performance Management Performance Management Employee Training & Empowerment Processes Knowledge Management
Key Success Factors Leadership Brand Power Long-Term Perspective SEARS Customer Focus Tireless Execution Complete Internal Alignment Around Strategy Measurement System
Contents I. The Sears Story II. Business Imperatives in the Connected Society III. The New Business Paradigm IV. Gap Analysis V. Actions and Implementation Plan VI. Key Success Factors
XXX Has Achieved Market Leadership in Consumer Electronics Worldwide Fortune magazine ranks XXX as the #5? consumer electronics company in the world Birth Expansion Leadership Global Market Share Leadership Revenue & Profit Growth Market Cap Growth
This Success Was Driven Primarily by Superior Operational Excellence Based on the“Make-and-Sell” Approach • Organized to produce large quantities of products efficiently and sell them to customers whose needs could be assumed, predicted, and controlled • Characterized by replaceable parts and economies of scale • Focus on products and processes • Emphasis on planning and control Profits Through Product Sales Volume & Cost Cutting Make Product Sell Product Design Product Advertise/ Promote Market R&D Procure Make Price Sell Distribute Service
eCommerce Convergence Internet Digital Value Virtual Community Open Standard Fundamental Changes Occurring in the Marketplace Are Requiring Samsung to Redefine its Basis for Competition Renewal Globalization New Business Model ? Active Inertia Leadership Value Growth Decline Birth Time Example: GE 80-81 86/87 91/92 99/00 Inflection Pt Business Model Market Share Leadership Productivity Services and Solutions Digital
1750 1860 1950 2000 Defining Application Social Implication Evolution of Business The Connected Society Marks the Transition To a New Era of Human History Transportation Revolution (Age of National Scale Transportation) Information Processing Revolution (Data Processing Age) Connected Society Revolution (Networked Society Age) Industrial Revolution (Age of Civilization) “We are in for a revolution” STEAM ENGINE TRANSNATIONAL RAILROAD INTERNET AND DIGITAL COMMUNICATION INTEGRATED CIRCUIT URBANIZED AND INDUSTRIAL SOCIETY REGIONAL SPECIALIZATION AND INTER-REGIONAL TRAVEL KNOWLEDGE WORKER-BASED ECONOMY GLOBALLY CONNECTED SOCIETY AND ECONOMY BLURRING ACCELERATION AND COMPRESSION SYNCHRONICITY LINEARITY & LIFE CYCLEs Source: E&Y The Leadership ConnectionTM Interviews
The Connected Economy Is Characterized by Three Key Forces Connection Speed Products Services Customer Intangibles Source: Blur, 1998
These Three Forces Are Destroying Old Solutions. . . • Markets and industries will be defined in terms of CUSTOMERS rather than products • Market power will shift from suppliers toward CUSTOMERS • More reliance will be placed on flexible, customized marketing and INTANGIBLE elements of the value proposition • Product life cycles will shorten • The need to choose between a high volume/low cost strategy and a niche/differentiation strategy will disappear • Maximizing the number of transactions with the same loyal customer by offering a diverse array of products and services will become increasingly important • The most productive business strategies will be cooperative, not competitive • Organizations will rely more on decision teams and parallel information processing and less on individual decision-making and sequential information processing
. . . Leading to Six Rules for Success in the Connected Society. 1 Focus on desired customers 2 Focus on competencies 3 Leverage partnerships 4 Identify differentiators 5 Create hybrid models 6 Be flexible and agile Source: E&Y Analysis
The New Organizational Premise is “Sense-and-Respond.” SENSE-AND-RESPOND Assumption: Unpredictable change Goal: Become an Adaptive Enterprise MAKE-AND-SELL Assumption: Predictable change Goal: Become an Efficient Enterprise Context - purpose and bounds - adptative structure Mission and Policy Strategy - objective - plan Coordination of Capabilities - commitment management An Open System Command and Control management system Adapting A Closed System Internal Feedback Structure functional hierarchy External Signals Source: Hackel, Stephen, Adaptive Enterprises, Boston:Havard Business School Press, 1999.
Transitioning to a Sense-and-Respond Organization Requires a Fundamental Shift Make-and-Sell Sense-and-Respond Continuum Business as an efficient mechanism for making and selling offers to defined market segments with predictable needs Mindset behind Strategic Intent Business as an adaptive system for responding to unanticipated requests in unpredictable environments Embedded in products Mass Production Efficiency and predictability Profit margins on products and economies of scale Functional and sequential activity Functionally managed and optimized Host-centric: hierarachical top-down command and control mgmt system Share of products and services Strategy as plan Know-How Embedded in people and processes Modular customization Invested in capailities and system Return on investmens and economies of scope Networked and paralleled activity and teams Enterprise management of essential information Network-centric: shadowing the dynamic network of people and teams Share of customer spending Strategy as adaptive business design Process Organizational Priority Profit Focus Operational Concept and Governance Mechanism Information Architecture Information Technology Architecture Market Leader Criteria Articulation of Strategy Source: Hackel, Stephen, Adaptive Enterprises, Boston:Havard Business School Press, 1999.
Contents I. The Sears Story II. Business Imperatives in the Connected Society III. The New Business Paradigm IV. Gap Analysis V. Actions and Implementation Plan VI. Key Success Factors
Full Potential Market Value Multiple($) Financial Performance Non-financial Performance Typical Time The Primary Business Objective for Samsung Is to Increase the Ultimate Value of the Company
The Challenge is to Determine How to Manage Company Resources to Create Maximum Financial Outcomes Full Potential Market Value Market Value Multiple($) Financial Performance Earnings Revenues x x = Invested Capital Revenues Earnings Non-Financial Typical Time (Profit Margin) (Growth / Reliability) (Capital Efficiency)
Increasingly, Investors Take Non-Financial Measures into Account When Valuing Companies Non-Financial Metrics Investors Value Most Full Potential • 1. Execution of corporate strategy • How well does management: • leverage its skills and experience? • gain employee commitment? • stay aligned with shareholder interests? • 2. Quality of strategy • Does management have a vision for the future? • Can it make tough decisions and quickly seize opportunities? • How well does it allocate resources? • 3. Ability to innovate • Is the company a trendsetter or a follower? • What is in the R&D pipeline? • How readily does the company adapt to changing technologies and markets? • 4. Ability to attract talented people • Is the company able to hire and retain the very best people? • Does it reward them? • Is it training the talent it will need tomorrow? • 5. Market share • Is the company capturing the value of the current market? • Is it well-positioned to expand that value in the future? • 6. Quality of executive compensation • Is executive pay tied to strategic goals? • How well is it gauged to the creation of shareholder value? • 7. Quality of major processes • 8. Research leadership • How well does management understand the link between creating knowledge and using it? Market Value Multiple($) Financial Non-financial Typical Time Key Findings from Market Studies • Nearly 40% (50% for high tech firms) of the market valuation of the average company was missing from its balance sheet (1996 Study) • Non-financial criteria constitute on average 35% of the investor’s decisions • The more non-financial measures analysts use, the more accurate are their earnings forecasts
0% 15% 0% 15% 0% 15% 0% 15% Non-Financial Data Have a Direct Impact on ValuationA one unit improvement in the perception of quality of management could represent a 13.2% price premium on share value % Increase in P/E Ratio given a one-unit change in…. Computer Industry Pharmaceuticals Food Industry Oil and Gas Non-Financial Criteria 1.4% 2.6% Quality of Management 7.6% 4.2% 13.2% 4.9% 2.5% 8.8% 0.9% 2.4% 1.4% Quality of Products and 5.8% 2.7% 9.6% 3.9% 7.2% Services Level of Customer 0.0% 0.0% 0.0% 0.0% Satisfaction 4.8% 2.5% 1.5% 1.3% Strength of Corporate 0.0% 0.0% 0.0% 0.0% 6.1% 2.1% 3.0% 1.3% Culture Quality of Investor 0.3% 0.8% 0.5% 0.9% Communications 1.8% 2.8% 4.6% 1.3% Effectiveness of Executive 0.4% 0.9% 0.6% 1.1% 4.4% 2.5% 2.9% Compensation Policies 1.2% 0.9% 5.3% 0.0% 1.6% Effectiveness of New 7.3% 3.2% 4.1% 1.8% Product Development 0.3% 0.0% 7.3% 3.1% Strength of Market Position 7.1% 9.3% 3.1% 1.2% Influence On Price Short Term Long Term Source: Ernst & Young’s Measures That Matter, 1997
Investor Customer • Buy • Price • Etc. • Buy • Hold • Etc. Supplier Employee • Cost • Stocking • Etc. • Productivity • Wage • Etc. 1 2 5 Therefore, a Compelling New Business Paradigm Should Focus on Measures That Matter, both Financial and Non-Financial Stock Price Allocation of Time and Money Operating Model Management Philosophy/ Point of View Value Invested VEM A B Constituency Behaviors F C E D ? C E S I TIME/MONEY PRICE ? Value Returned Value Invested Cutomer Focus SYSTEMS TIME KNOWLEDGE CAUSAL MODEL 3 4 • Calibrate Stock Value Gap • Model Profile Constituency/Behaviors that Matter • Create Causal Model/VE Optimization Capability • Redesign Enterprise Processes/ Overall Architecture • Transition Enterprise to a Customer Focus Point of View
The New Business Paradigm Development Proceeds with the Following Five Steps 1 Company Vision 2 Business Strategy • Who are we and what do we do? 3 Value Propositions • Where should we go? 4 Strategic Operation Model • What are our “promises” to: • customers • employees • partners • investors 5 Portfolio of Initiatives • How will we get there? • Business Structure • Business System • Organization Structure • How will we deliver it?
This Effort Addresses Four of the Five Components Where should we go? How do we get there? How do we deliver it? What are our “promises”? Business Strategy Operating Model Portfolio of Initiatives Value Propositions • A definition: The intentional choice of where, how, and when to compete… • …resulting in significant (or largely irreversible) commitments of resources — capital or human • Effective strategy considers marketplace and internal issues, is fact-based, and owned by those responsible for implementation Framework which defines internal business structures, processes and systems: • Implementation initiatives focused on improving current business process performance... • …while maintaining the benefit of a high-touch environment • …and enabled by information technology, measurement systems, and infrastructure • Develop comprehensive offering for target customers • Define compelling reasons: • for employees to work at Samsung • for partners to work with Samsung • for investors to invest in Samsung • High level business unit structure and process structure design • Business system definition • Organization structure
Customer Strategy Know Who Are Your Customers Customer Behaviors Outcome Measures Know What Your Customers Do Understand Your Relationship with the Customer Know What Your Customers Are Worth Exchange Value with Your Customers Customer Economics Delivery Strategy Determine How to Deliver Know What You Can Get Back Decide What to Give Your Customers Capability Specifications Opportunity Identification Opportunity Design A Customer Driven Organization Performs Six Key Customer Processes Identify Target Customers Manage customer relationship Determine Customer Lifetime Value Fulfill Promises Define go-to-market strategy Develop Offerings
Customer Driven Business Framework Customer Knowledge Management CRM Development Customer Strategy Field Services Ad Campaign NPD SCM Offer Development Business Strategy Service & Support Vision Communication Go-to-Market Strategy Value Proposition Pricing Channel Promotion Product Design Brand Strategy Customer Care Salesforce Competencies Processes Op Model Organization Design Performance Metrics
What Will It Look Like When Samsung Has Transformed into a Customer Driven Organization? Product-Focused Customer-Focused Manager Role Product Manager Customer Portfolio Manager Managerial Scope Managed by customer segment or portfolio of individual customers Managed by sales region Volume, product profitability, market share, customer satisfaction Lifetime value, product mix, customer profitability, share of wallet, customer retention Measures Required Knowledge • Market growth • Pricing studies • Assessment of competitive landscape • Customer satisfaction • Geographic sales breakdown • Brand perception/perception of quality • Customer’s Lifetime Value • Customer’s current product portfolio • Customer’s point in lifecycle (customer needs) • Customer’s history with company • Customer’s preferred access channel • Cost to acquire, serve and retain Source: E&Y Analysis
Activities and Behaviors Value propositions defined by key customers/segments for product/service offerings Globally integrated and shared customer knowledge management Metrics developed to track degree of customer focus Customer-focused measures & targets shared by different functions in XXX value chain Customer attraction & retention rates tracked Share of wallet defined and tracked for key segments Customer profitability captured & used to manage customer portfolio Pricing & channel actions are no longer reactive, but based on CRM strategy New product/service development includes market research, customer and field input, and cross-functional team approach Results Price parity with leading brands for comparable products Brand parity in terms of recognition and positive image Increased brand equity reflected in above-average performance of XXX stock relative to peer competitors Customer attraction & retention rates increase Share of wallet increases for key segments Customer profitability increases XXX profitability, EVA, and ROA increase What Will It Look Like When XXX Is Customer-Driven?
Measuring Customer Focus in the New Environment Leading Indicators (Drivers): Customer Value Proposition = + + Value to Customer Product/Service Attributes Image Relationship Functionality Quality Price Time Brand After-Sales Service Examples of attributes: (Examples of measures:) (External product ratings) (Warranty) claims (Relative price ratio) (Back order rate) (Brand survey rating) (Response time, problem resolution rate) Lead To Lagging Indicators (Outcomes): Customer Response Market and/or Wallet Share (Examples of measures:) (Share points) Customer Acquisition Customer Profitability Customer Retention (% new customers in target segments) (Fully-costed margin in target segments) (# of repeat sales in target segments) Customer Satisfaction (CSI) Adapted from: The Balanced Scorecard, Kaplan & Norton, 1996
Contents I. The Sears Story II. Business Imperatives in the Connected Society III. The New Business Paradigm IV. Gap Analysis V. Actions and Implementation Plan VI. Key Success Factors
Marketing IQ Test True False Don’t Know 1. Businesses in America were reasonably successful during the 1980s, enjoying real growth in sales of 2 percent or more per year. 2. During the coming decade, marketers will earn more profits from new brands than from existing ones. 3. A high share of market in a product category generally leads to economies of scale that result in a high level of profitability. 4. There is little agreement among marketers about what the hot new concept “brand equity” means. 5, A reasonable way to set the marketing budget is to take last year’s figure and adjust for inflation. 6. Line extensions are a very risky way to introduce new products. 7. Focus group interviews are a serious marketing research tool that a manager can safely use to help make serious marketing decisions. 8. Business today invest more money in finding new customers than in further developing current customers. 9. The most profitable customers of a firm are usually its biggest customers. 10. Big companies generally make their marketing decisions after evaluating many alternatives in terms of profitability.
Marketing IQ Test (Cont’d) True False Don’t Know 11. The more appealing a new product concept is to prospective buyers, the more likely it is it will be a success. 12. Every company should strive to hold on to all of its customers. 13. Location is the most important determinant of success for a new retail business. 14. One-hundred percent customer satisfaction is not an intelligent business objectives. 15. Media planners at major advertising agencies know a great deal about the relative effectiveness of print, television, and radio advertising. 16. Because pricing is such an important component in the marketing mix, most big companies have a serious pricing strategy based on pricing research. 17. Nielsen’s television rating service--especially the new “people meter”--provides valid information about the number of people watching a particular television program. 18. Consumer and trade promotional programs tend to be more profitable than advertising. 19. Companies cannot quantify the effects of public relations programs. That's one reason why PR is a less valuable components of the marketing mix than advertising or the sales force. 20. Most marketing and advertising programs usually are measured in terms of their profitability. Total:
What is Your Marketing IQ? If you scored: You are: 150 - 160 130 - 149 110 - 129 90 - 109 70 - 89 50 - 69 30 - 49 11 - 29 1 - 10 A marketing genius A guru, a maven An up-and-coming consultant A seasoned professional A typical marketer A death-wish marketer An incompetent Dangerous to your company Guilty of malpractice
Contents I. The Sears Story II. Business Imperatives in the Connected Society III. The New Business Paradigm IV. Gap Analysis V. Actions and Implementation Plan VI. Key Success Factors
An Operating Model Is the Primary Mechanism for "Operationalizing" Business Strategy Where should we go? How do we get there? How do we deliver it? What are our “promises”? Value Propositions • Develop comprehensive offering for target customers • Define compelling reasons: • for employees to work at Samsung • for partners to work with Samsung • for investors to invest in Samsung Portfolio of Initiatives Business Strategy Operating Model
An Operating Model Is the Primary Mechanism for "Operationalizing" Business Strategy Where should we go? How do we get there? How do we deliver it? What are our “promises”? Operating Model Framework which defines internal business structures, processes and systems: • High level business unit structure and process structure design • Business system definition • Organization structure Portfolio of Initiatives Business Strategy Value Propositions
One Operating Business Unit Sales Marketing Call Center (Service) Billing Operators Remittance Processing System Control Center Ops Generation Engineering and Construction Environmental Regulatory (Lobbying) Legal Services Human Resources Finance External Affairs Business Planning Administration Operating Models Consist of Three Primary Components Strategic Operating Model Business Structure 1 Business System 2 Low Cost Differentiated Services Energy Generation Unit (Genco) Transaction Management Organization Structure 3 Energy Delivery Unit (Transco) Customer Operations Unit (Disco) By-Product (Ash) Management Regulatory Compliance Sales Competencies Environmental Compliance Maintenance Maintenance Marketing Operations Operations Product Development Engineering Customer Service Regulatory (Lobbying) Legal Services Human Resources Finance External Affairs Business Planning Administration Business Processes • Identification of business unit structure, organized around customers, markets, products, geographies, etc. • Delineation of dedicated and shared services across business units • Preliminary evaluation of profit & loss responsibility, revenue responsibility, and cost centers • Articulation of “rules of engagement” — A.K.A. “How things really get done” Knowledge Management Performance Management • Organizational Structure describes at a high level all elements of: • reporting structures • roles & responsibilities • jobs & skills • Design of an organizational structure that is aligned with the strategy and other operating model components • Clearly identified and defined business system components that support the strategy and the high level business structure Our focus
Operating Model Development: Business System Competencies (Staffing, Training, Development) Change Management Business Processes Business Processes Knowledge Management & Information Systems Performance Management