Download
1 / 19
190 likes | 582 Vues
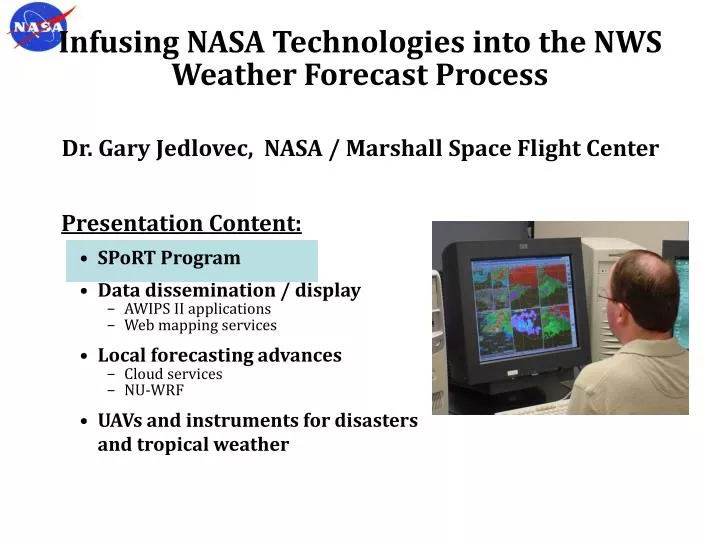
Infusing NASA Technologies into the NWS Weather Forecast Process. Dr. Gary Jedlovec, NASA / Marshall Space Flight Center. Presentation Content: SPoRT Program Data dissemination / display AWIPS II applications Web mapping services Local forecasting advances Cloud services NU-WRF

E N D
Infusing NASA Technologies into the NWS Weather Forecast Process Dr. Gary Jedlovec, NASA / Marshall Space Flight Center • Presentation Content: • SPoRT Program • Data dissemination / display • AWIPS II applications • Web mapping services • Local forecasting advances • Cloud services • NU-WRF • UAVs and instruments for disasters and tropical weather
forecast problems data, models Impact, assessment training community collaborators end users Research Transition NASA’s Short-term Prediction Research and Transition (SPoRT) Project • SPoRT is focused on transition of unique observations and research capabilities to the operational weather community, to improve 0-48 hour forecasts on the regional and local scale • Activities began in 2002, with first NASA products in AWIPS in Feb 2003 • Close collaborations with NWS and selected WFOs • Match forecast problems to capabilities / data, demonstrate in a “test bed”, transition to operational system, and provide user training • Feedback from end user on utility of NASA products • End user involvement throughout the entire process Operational End Users transition teams collaborators end users Testbed SPoRT transitioning unique NASA data and research technologies
SPoRT Partners and Collaborators Partners Receiving Data SPoRT Partner WFOs NWS Regional HQs Direct Broadcast sites • Partner with NOAA / OST, NESDIS, NWS Regions, Universities and WFOs • Collaborate with WFOs and various National Centers • In-depth collaborations with 14 WFOs, provide a suite of over 30 unique products, regular interactions and product assessments • Close collaborations with NWS and selected WFOs • Science Advisory Committee suggest SPoRT consider expansion to other regions – endorsed by NWS Science Services Division Chiefs • strategic, project focused, involve a few new WFOs in each Region • example – lake effect precipitation processes using MODIS / AMSR-E Great Lakes water temperatures in forecast models Use of NASA research data in the operational environment has immediate impact on NOAA mission and prepares forecasters for use of similar data / products from future NOAA operational measurements / products – JPSS, GOES-R transitioning unique NASA data and research technologies
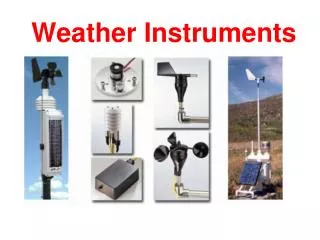
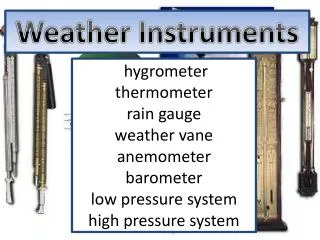
transitioning unique NASA data and research technologies SPoRT Product Suite / NWS Forecast Challenges • Forecast Challenges • timing and location of precipitation and severe weather events • local temperatures and moisture variations • detection and monitoring of fog, smoke, fires • coastal weather processes • development / movement of off-shore precipitation processes and tropical systems • gap filler in data void regions – atmospheric rivers of moisture • Product Suite • Satellite – MODIS, AMSR-E, GOES • high resolution imagery (vis, IR, WV) • spectral difference and RGB composites • moisture and cloud products • rain rate, blended TPW and high resol. SSTs • land surface products • Remote Sensing • Total lightning observations Special analysis • Local mesonet data • NASA Land Information System
Operational Uses of Total Lightning Data transitioning unique NASA data and research technologies Relevance to NWS Forecasters • Demonstrating application of ground-based total lightning networks in advance of future NOAA operational capabilities (GOES-R GLM) • Most ground based systems do not effectively detect total lighting Pseudo GLM Flash Extent LMA Source Densities Unique NASA Contributions • help develop and deploy several ground-based total lightning networks • incorporation of total lightning data within AWIPS/AWIPS 2 for overlay with traditional radar and other analyses • develop training and product assessment • translate total lightning trends into severe weather precursors • working with NOAA GOES-R Proving Ground to demonstrate future capabilities from space
transitioning unique NASA data and research technologies Sea / Lake Surface Temperature Composites NOAA/GLERL Ice Mask Relevance to weather forecasting and coastal applications • provide high resolution detail for coastal and marine forecasts Unique SPoRT/NASA Contributions • high resolution (1km) MODIS and AMSR-E composites – 4x daily • provides coverage throughout North America and the tropics, depicts coastal and Gulf Stream gradients • unique application over the Great Lakes that includes lake ice analyses from the NOAA Great Lakes Environmental Research Laboratory (GLERL) Forecast impact • cloud and precipitation processes in sensitive to SST changes and spatial variations in coastal regions • lake effect precipitation • coastal weather including tropical storm impact
transitioning unique NASA data and research technologies Future Direction • Continue to demonstrate utility of current and future NASA observations • Decision support systems • AWIPS / AWIPS2 • Google Earth • JPSS (NPP / NPOESS) • VIIRS and CrIMSS data and products to WFOs • GOES-R • ABI and GLM applications • Expand partners and end users • Work more collaboratively with regional centers and other test beds • Expand to WFOs in other regions
Presentation Content: • SPoRT Program • Data dissemination / display • AWIPS II applications • Web mapping services • Local forecasting advances • Cloud services • NU-WRF • UAVs and instruments for disasters and tropical weather Infusing NASA Technologies into the NWS Weather Forecast Process Visible with Fire and Smoke Detections
EDEX Plug-ins CAVE Plug-ins Standard Ingest SBN, NOAAPort Other AWIPS II Database GINI GRiB2 Roam / zoom SPoRT Data Enhanced Displays RGB imagery 3D displays Enhanced Ingest McIDAS AREA Point data Shape files AWIPS / AWIPS II • One of the keys to successful transition is the availability of data / products in user decision support systems – AWIPS / AWIPS II • SPoRT has developed procedures to ingest unique NASA data into AWIPS and shared these capabilities with community • Developing unique plug-ins for AWIPS II environment • Ingest of unique research data into database, preserving highest resolution and precision of the data (AWIPS – 8 bit; AWIPS II – 16 bit data storage) • Enhanced visualization – RGB channel composites, 3D displays, new product integration • Partnered with private sector to explore collaboration tools which utilize KML data structures in Google Earth
Web Mapping Services • Large data volumes from high resolution multispectral / multi-temporal satellites (JPSS, GOES-R) and limited data bandwidth into WFOs and some National Centers • Limits access to unique data in real-time or coverage regions • All WFOs do not need same data streams • NASA SBIR with GST to demonstrate application of web mapping services • forecasters can initiate a request to search unique high resolution data applicable to current weather situation • data delivered automatically into AWIPS II • Forecaster thought process: • “GOES data seems to indicate fog developing over TN Valley. Can VIIRS data better diagnose this?” • Forecaster: • Initiates search command looking to available WMS for data • WMS subsets and formats data for AWIPS • Initiate secure transfer to LDM for ingest into AWIPS II WMS Schematic for VIIRS Data on NPP / JPSS
Presentation Content: • SPoRT Program • Data dissemination / display • AWIPS II applications • Web mapping services • Local forecasting advances • Cloud services • NU-WRF • UAVs and instruments for disasters and tropical weather Infusing NASA Technologies into the NWS Weather Forecast Process
NASA Cloud Service • Capability to provide rapidly deployable infrastructure (CPUs, memory, etc.) to address research and near real-time Earth science needs • Networked facilities at GSFC and Ames (and other Centers in the future) • Resources for data storage and dissemination, repeated execution of complex algorithms and models • Resources could be used for real-time dissemination of NASA satellite data to the operational weather community (could support WMS for dissemination to AWIPS II) • Used to run multiple configurations of complex models (such as NU-WRF) demonstrating impact of NASA data on regional and local weather forecasts forecasts Data Dissemination Schematic for Large Data Sets
NASA Unified Weather Research and Forecasting (WRF) ModelMSFC Collaborators with GSFC (PI: Christa Peters-Lidard) Annual Aerosol-Rainfall Monsoon Cycle over India NASA Unified-WRF (NU-WRF) Model • Enable better use of NASA high-resolution satellite data for short-term weather research • Reduce redundancy in major WRF development • Prolong the serviceable life span of the WRF NU-WRF Components • Based on Advanced Research WRF dynamical core • NASA Components and Contributions • GSFC microphysics and short/longwave radiation physics • GSFC Chemistry Aerosol Radiation and Transport physics • Satellite Data Simulator Unit • Land Information System (LIS) • NSSL/SPoRT severe convection and lightning diagnostics Co-variability of absorbing aerosols and rainfall over Indian subcontinent suggests that aerosolsmay interact with clouds and rain in this region. • Science questions – Operational impacts • Hurricane/typhoon simulations with aerosols/dust • Coupled land surface/aerosols/satellite assimilation experiments • California heavy snow and severe weather cases in the U.S.
Presentation Content: • SPoRT Program • Data dissemination / display • AWIPS II applications • Web mapping services • Local forecasting advances • Cloud services • NU-WRF • UAVs and instruments for disasters and tropical weather Infusing NASA Technologies into the NWS Weather Forecast Process
Hurricane Imaging Radiometer (HIRAD) • Joint technology development between NASA / MSFC, NOAA / HRD, and University Community (Michigan, Central Florida, UAHuntsville) • Microwave radiometer designed to measure strong ocean surface winds, rain rate and SSTs • Extends measurements of the Stepped Frequency Microwave Radiometer (SFMR) to wide swath with detailed spatial resolution • C-band – 4,5,6,6.6 GHz • Real aperture along track, synthetic aperture across track (no moving parts) • Successful participation in 2010 GRIP hurricane experiment on WB-57 • Future integration on Global Hawk – Venture Class airborne mission with GSFC (2012-2014) Spacecraft instrument would extend scatterometer measurements to strong winds (up to 85 m/s) through heavy rain with improved spatial resolution
HIRAD Example from GRIP Joint SFMR and HIRAD brightness temperature comparisons for Hurricane Earl, September 1, 2010 Note that brightness temperature agreement is to be expected only at HIRAD nadir. UCF
Real Time Mission Monitor (RTMM) Integrates satellite, airborne, and surface data sets into a single real-time display system Tracks airborne vehicle state information Displays model and forecast parameter fields Utilizes distributed Web-based architecture The Real Time Mission Monitor (RTMM) is an interactive visualization application that provides situational awareness and field asset management to enable adaptive and strategic decision making during airborne field experiments – potential for operational weather and disaster applications Used in a variety of field campaigns supporting NASA and NOAA missions
RTMM User Base Research Scientists Program and Project Managers Pilots and Flight Engineers Educators and Students Media and Public Affairs Science Attentive Public Integrating science and airborne weather applications John Molinari and Jeff Halverson use RTMM on the DC-8 during GRIP RTMM enables: • Real time interactions and collaborations • Post-flight mission review and case study development RTMM used in the cockpit of the DC-8 during GRIP on September 6, 2010. demo
Infusing NASA Technologies into the NWS Weather Forecast Process • Summary: • SPoRT Program • Data dissemination / display • AWIPS II applications • Web mapping services • Local forecasting advances • Cloud services • NU-WRF • UAVs and instruments for disasters and tropical weather