Download
1 / 47
470 likes | 854 Vues
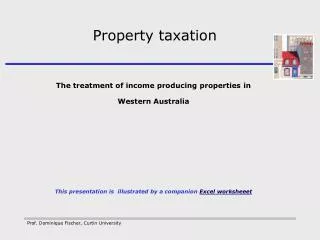
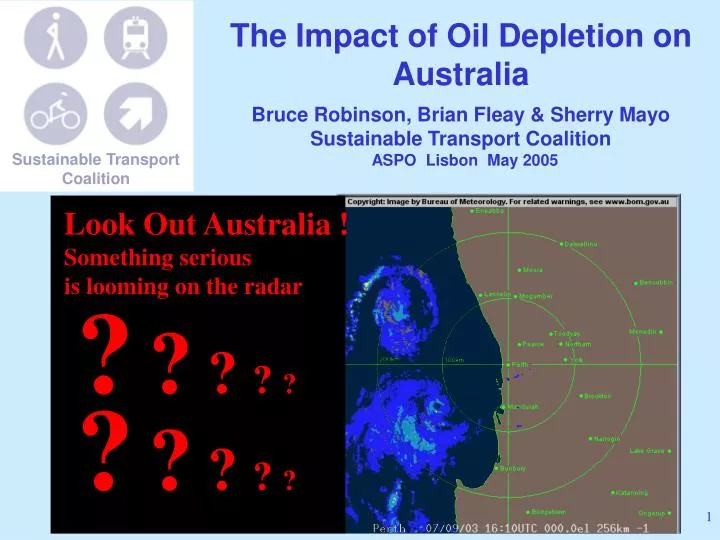
The Impact of Oil Depletion on Australia Bruce Robinson, Brian Fleay & Sherry Mayo Sustainable Transport Coalition ASPO Lisbon May 2005. Sustainable Transport Coalition. Look Out Australia ! Something serious is looming on the radar . ? ? ? ? ? ? ? ? ? ?. Summary

E N D
The Impact of Oil Depletion on Australia Bruce Robinson, Brian Fleay & Sherry Mayo Sustainable Transport Coalition ASPO Lisbon May 2005 Sustainable Transport Coalition Look Out Australia ! Something serious is looming on the radar ?? ? ? ? ?? ? ? ?
Summary Australia, now Oil demand, production, use (transport) Geography, population 3 different countries remote, rural, urban High Oil Vulnerability Australia will be badly affected by oil depletion, unless substantial changes are made Possible change options for government
=1.3 EfT3 Australia uses 45,000 megalitres of oil each year a 360m cube Sydney Harbour Bridge is 134 m high 80% of Australia’s oil usage is in transport If Australia’s 20 M tpa wheat crop → ethanol = 9%
Total Oil Consumption Production Net imports M bbl/day China 20 EU 15 + Norway Australia 10 l l 1 km United States 0 Aust Eu-15+ USA China Japan Aust Eu-15 USA China Japan Oil consumption bbl/day/1000 people Registered vehicles /1000 people 70 60 50 40 30 20 10 0 Aust Eu-15 USA China Japan
Australia's liquid fuel production decline began in 2001. Powell, Geoscience Australia, 2001
Australia’s oil production and consumption 1965-2030 Actual Forecast 1.0 Million barrels/day Consumption 0.8 0.6 Production 0.4 P50 0.2 0.0 1965 2005 2025 1985 Geoscience Australia, APPEA, ABARE
Evolution of Forecasts of Australian Oil Production Geoscience Australia (Australian Geological Survey) k bbl/day Actual Forecasts
Evolution of Forecasts of Australian Oil Production Geoscience Australia (Australian Geological Survey) k bbl/day Actual Forecasts Past liquids production forecasts have often proven too low. NGL production depends on gas contracts
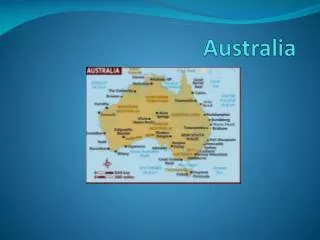
Australia “A wide brown land” “The Tyranny of Distance” Annual rainfall mm 3200 1600 Perth to Sydney 3300 km 800 400 Big Mostly arid Mostly low fertility soils 20 M people Already exceeding sustainable population
Europe and Australia by night – same scale, same brightness
Remotenessclassification Major cities Inner regional Outer regional Remote Very remote Outer regional Very remote Remote 3 separate countries Remote Regional Urban 3% 31% 66% Inner regional Major cities
Remote Australiamining, pastoral, indigenous Blackstone community Indigenous communities 2.4% of Australians are indigenous ROAD ACCESS:800 km to Alice Springs. 1110 km to Kalgoorlie Weekly police patrol visits by vehicle from Laverton, 750 km to the West. Twice weekly small aircraft from Alice Springs to Kalgoorlie, The largest dots indicate 500 people or more, the smallest less than 50
Blackstone Community Circa 100-200 people ROAD: 800 km to Alice Springs (food and fuel)
Iron ore train, Pilbara ~ 200M tonne p.a. Road trains
Brockman Iron Formation, near Mt Tom Price, NW Western Australia
Rural Australia Sparsely populated
wealth car use US Aus Europe Urban/Suburban Australia Institute for Sustainability and Technology Policy Murdoch University, Perth City wealth vs car use per capita (1990)
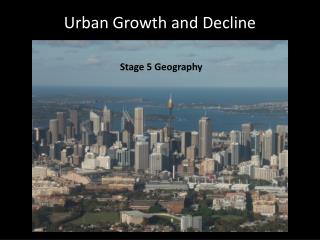
Urban Australia Keilor Downs NW Melbourne
30 km KeilorDowns Melbourne Urban Sprawl
Urban passenger mode shares Australia Car High automobile-dependence Public transport share is very low Potterton BTRE 2003
Non-urban passenger outlook: Air grows faster than other modes Air passenger Car Potterton BTRE 2003
$10 PER LITRE PETROL: A SCENARIO (a ten-fold increase) David Rice, Senior WA Transport Planner The scenario means “What if petrol reaches $10/l? Planners should include this scenario, as well as “business-as-usual” But why $10/l? Simple memorable an illustration of ‘expensive’ www.stcwa.org.au/beyondoil/$10petrol.doc
The impact of oil depletion on Australian cities. The bushfire analogy The Canberra fire-storms of January 2003 destroyed over 400 houses; on the outer edge of the outer suburbs Reliable predictions had been ignored by the authorities, and there was no effective action to minimise the risks
Satellite image of Canberra region showing fire-damage from the west. January 2003. Red hues are burnt areas. White lines show suburbs
Oil shocks, like the $10/litre scenario, may well wipe out the entire outer rows of suburbs from Perth, with the same results of destroyed homes, broken dreams and broken marriages. Perth 30 km
Oil shocks, like the $10/litre scenario, may well wipe out the entire outer rows of suburbs from Perth, with the same results of destroyed homes, broken dreams and broken marriages. Perth 30 km
Oil shocks, like the $10/litre scenario, may well wipe out the entire outer rows of suburbs from Perth, with the same results of destroyed homes, broken dreams and broken marriages. Perth 30 km
Oil shocks, like the $10/litre scenario, may well wipe out the entire outer rows of suburbs from Perth, with the same results of destroyed homes, broken dreams and broken marriages. Perth 30 km
The outskirts of all Australian cities will be hard hit by oil depletion, as public transport infrastructure is very poor Perth 30 km
short most ^ UK National Newspaper The Guardian Tuesday December 2, 2003 “Bottom of the barrel The world is running out of oil- so why do politicians refuse to talk about it? Every generation has its taboo ..the resource upon which our lives have been built is running out. We don't talk about it because we cannot imagine it. This is a civilisation in denial”. George Monbiotsee www.monbiot.com
June 15, 2004 Govt releases new energy strategy Future oil summary, IEA only “No Worries” Another “Intelligence Failure” like WMD?
Western Australian State Government “Production itself is likely to peak, maybe as early as 2006, but more conventionally 2010 – 2015” “It is also certain that the cost of preparing too early is nowhere near the cost of not being ready on time.” WA Minister Alannah MacTiernan Queensland State Parliament “Peak oil represents the most serious and immediate challenge to our prosperity and security. It will impact on our lives more certainly than terrorism, global warming, nuclear war or bird flu.”
Gb/year Efficiency Demand Growth World oil shortfall scenarios Transport mode shifts Pricing / taxes City design/lifestyle Past Production of Oil Other petroleum fuels gas, tar-sands Other fuels Deprivation, war Forecast Production 2005 no single “Magic Bullet” solution, Noah! Start now! Hard to build the ark under water after Swenson, 2000
Individualised Marketing: Travel behaviour changeEquivalent to discovering another Iraq? Reducing automobile travel can produce “nega-barrels”* of oil more cheaply than oil can be found by exploration. (*negative oil, saved by conservation) Discovering another Iraq ? About half the world’s 80 million barrels of oil per day goes on road transport. A 5% reduction in global motor vehicle transport usage would save about as much oil as Iraq now produces (circa 2M b/d). Reduction of 10% in US travel alone would save half an “Iraq”. Large programs in cities in Germany, Australia & Sweden have shown sustained average reductions of 13% in car-kms travelled. Individualised Marketing informs interested people of available travel options. They are empowered to choose different travel modes and to reduce unnecessary travel. The strategy (IndiMark®) was developed by Munich firm Socialdata. www.STCwa.org.au/negabarrels www.Socialdata.de
Petrol taxes OECD € UK Au$ cents/litre Portugal 0.80 0.60 Australia 0.40 0.20 US 0.00 IEA Dec 2003
The UK Fuel Tax Escalator Margaret Thatcher pence Nominal tax per litre (pence) 50 Real tax 40 30 20 10 0 1988 1990 1992 1994 1996 1998 Australian fuel taxes should be raised to European levels on a fuel tax escalator
“Add in the geopolitical costs of oil andthe case for raising petrol taxes, especially in America, becomes overwhelming” April 30th- May 6th 2005
Water Analogy for Fuel Pricing A personal fuel SmartCard system could tax petrol and diesel on a sliding scale like water. People could trade unused allocations to those who want more fuel. A rational pricing system Perth domestic water Renewable scarce resource
There are innumerable “Perverse” subsidies Tax on cars as part of salary to roads, 4WDs profligate vehicle users heavy inefficient vehicles Supermarket petrol discounts People who walk to the supermarket are subsidising those who drive in the big SUVs
Participatory Democracy 1300 people at city planning workshop Perth 2003 Oil depletion action needs an informed and engaged community
Australian Government Policy and Action Options 1: “Talk about it, Talk about it” 2. Engage people, “Participatory democracy” 3. Dismantle the "perverse policies" that subsidise heavy car use and excessive freight transport. 4. Encourage frugal use of fuel, and disadvantage profligate users. Fuel taxes should be incrementally raised to European levels to reduce usage. 5: SmartCard personal fuel allocation system. A flexible mechanism for short-term oil shocks, as well for encouraging people to reduce their fuel usage.. 6. Concentrate on the psychological and social dimensions of automobile dependence, not just “technological fixes” 7. Implement nationwide "individualised marketing" travel demand management. 8. Railways, cyclepaths and public transport are better investments than more roads. 9. Give priority for remaining oil and gas supplies to food production, essential services and indigenous communities, using the Smart-Card system. 10. Review the oil vulnerability of every industry and community sector and how each may reduce their risks. 11 Promote through the United Nations an Intergovernmental Panel on Oil Depletion, and a Kyoto-like protocol to allocate equitably the declining oil among nations. An international tradable sliding scale allocation mechanism is one hypothetical option.
Australia must not let the opportunities slip away Many of the policy options to reduce fuel usage will also lead to wealthier, healthier and happier communities. Australia is very well placed globally Big attitude changes in past; to race, gender, smoking, water.. World-leading demand management skills TravelSmart and water conservation Considerable uncommitted gas reserves Failure to act now will prove incredibly costly Abstract at www.STCwa.org.au/aspo See our “Oil: Living with Less” policy Sustainable Transport Coalition www.STCwa.org.au
“Oil: Living with Less” at www.STCwa.org.au Bicycles are powered by biomass, renewable energy, either breakfast cereal or abdominal fat No shortage of either
Australia US China