Download
1 / 5
50 likes | 60 Vues
https://www.irjet.net/archives/V6/i2/IRJET-V6I204.pdf

E N D
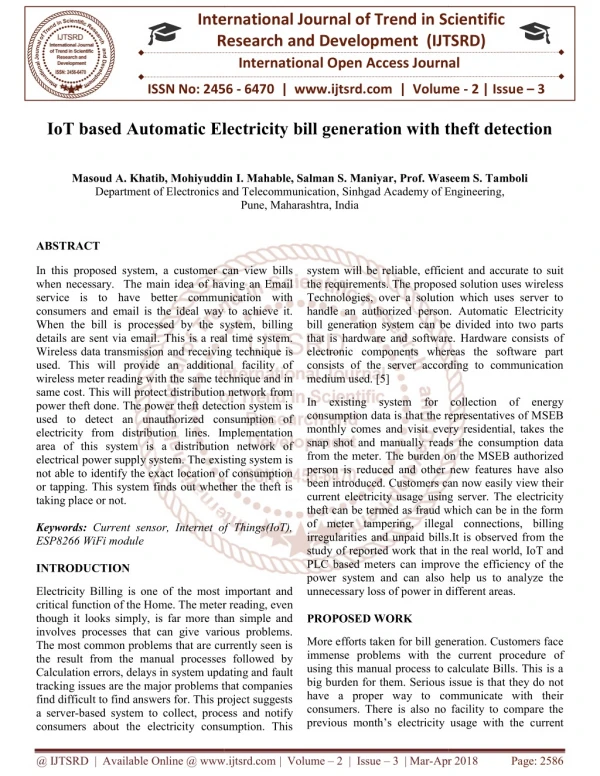
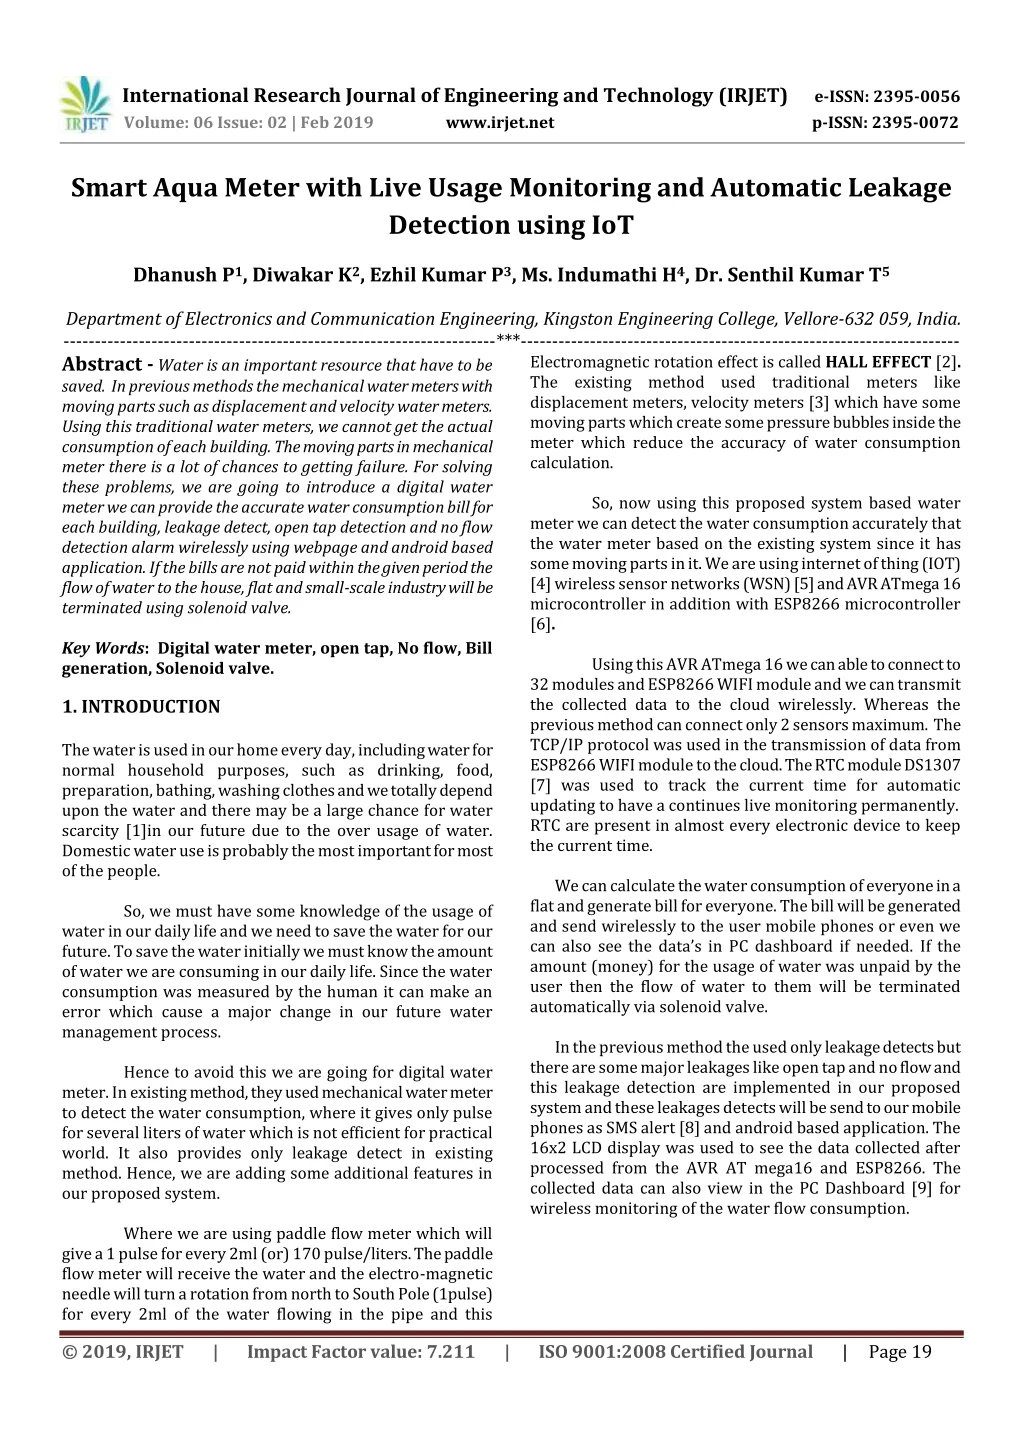
International Research Journal of Engineering and Technology(IRJET) e-ISSN: 2395-0056 Volume: 06 Issue: 02 | Feb 2019 www.irjet.net p-ISSN: 2395-0072 Smart Aqua Meter with Live Usage Monitoring and Automatic Leakage Detection using IoT Dhanush P1, Diwakar K2, Ezhil Kumar P3, Ms. Indumathi H4, Dr. Senthil Kumar T5 Department of Electronics and Communication Engineering, Kingston Engineering College, Vellore-632 059, India. ---------------------------------------------------------------------***---------------------------------------------------------------------- Abstract -Water is an important resource that have to be saved. In previous methods the mechanical water meters with moving parts such as displacement and velocity water meters. Using this traditional water meters, we cannot get the actual consumption of each building. The moving parts in mechanical meter there is a lot of chances to getting failure. For solving these problems, we are going to introduce a digital water meter we can provide the accurate water consumption bill for each building, leakage detect, open tap detection and no flow detection alarm wirelessly using webpage and android based application. If the bills are not paid within the given period the flow of water to the house, flat and small-scale industry will be terminated using solenoid valve. Key Words:Digital water meter, open tap, No flow, Bill generation, Solenoid valve. Electromagnetic rotation effect is called HALL EFFECT [2]. The existing method used traditional meters like displacement meters, velocity meters [3] which have some moving parts which create some pressure bubbles inside the meter which reduce the accuracy of water consumption calculation. So, now using this proposed system based water meter we can detect the water consumption accurately that the water meter based on the existing system since it has some moving parts in it. We are using internet of thing (IOT) [4] wireless sensor networks (WSN) [5] and AVR ATmega 16 microcontroller in addition with ESP8266 microcontroller [6]. Using this AVR ATmega 16 we can able to connect to 32 modules and ESP8266 WIFI module and we can transmit the collected data to the cloud wirelessly. Whereas the previous method can connect only 2 sensors maximum. The TCP/IP protocol was used in the transmission of data from ESP8266 WIFI module to the cloud. The RTC module DS1307 [7] was used to track the current time for automatic updating to have a continues live monitoring permanently. RTC are present in almost every electronic device to keep the current time. We can calculate the water consumption of everyone in a flat and generate bill for everyone. The bill will be generated and send wirelessly to the user mobile phones or even we can also see the data’s in PC dashboard if needed. If the amount (money) for the usage of water was unpaid by the user then the flow of water to them will be terminated automatically via solenoid valve. In the previous method the used only leakage detects but there are some major leakages like open tap and no flow and this leakage detection are implemented in our proposed system and these leakages detects will be send to our mobile phones as SMS alert [8] and android based application. The 16x2 LCD display was used to see the data collected after processed from the AVR AT mega16 and ESP8266. The collected data can also view in the PC Dashboard [9] for wireless monitoring of the water flow consumption. 1. INTRODUCTION The water is used in our home every day, including water for normal household purposes, such as drinking, food, preparation, bathing, washing clothes and we totally depend upon the water and there may be a large chance for water scarcity [1]in our future due to the over usage of water. Domestic water use is probably the most important for most of the people. So, we must have some knowledge of the usage of water in our daily life and we need to save the water for our future. To save the water initially we must know the amount of water we are consuming in our daily life. Since the water consumption was measured by the human it can make an error which cause a major change in our future water management process. Hence to avoid this we are going for digital water meter. In existing method, they used mechanical water meter to detect the water consumption, where it gives only pulse for several liters of water which is not efficient for practical world. It also provides only leakage detect in existing method. Hence, we are adding some additional features in our proposed system. Where we are using paddle flow meter which will give a 1 pulse for every 2ml (or) 170 pulse/liters. The paddle flow meter will receive the water and the electro-magnetic needle will turn a rotation from north to South Pole (1pulse) for every 2ml of the water flowing in the pipe and this © 2019, IRJET | Impact Factor value: 7.211 | ISO 9001:2008 Certified Journal | Page 19
International Research Journal of Engineering and Technology(IRJET) e-ISSN: 2395-0056 Volume: 06 Issue: 02 | Feb 2019 www.irjet.net p-ISSN: 2395-0072 2. SYSTEM ARCHITECTURE out as signals, by converting the number of revolutions into the flow rate we can find the amount of water consumed. FLOW CLACULATION METHODS Instantaneous flow = Fig-2: Paddle flow meter Fig -1: Block diagram 2.5. Real Time Clock Module DS1307 A real Clock module is essentially a time trailing device which provides the present time and date. RTC module that comes with DS3231 IC have the supply to line alarms. RTC module with clock chip DS1307 supported on I2C protocol. The module provides details such us North American country second, minute, hour, day of week, day of month, month and year including correction for leap year. It will operate either in twelve hours or in 24-hour format. Current consumption of this module is Nano ampere vary. Even a 3v battery can power it for 10 years maintain an accurate cloak and without any external power. 2.6. LCD Display (16x2) LCD (liquid crystal display) screen is an electronic display module and find a wide range of applications A 16x2 LCD display is very commonly used in various devices and circuits. A 16x2 LCD Display means it can display 16 characters per line and there are 2 such lines. 2.7. Relay A relay could be a special kind of switch turned on associated degreed off by a magnet. When a current flow through the coil an electro-magnetic field is set up. The field attracts associate degree iron coil, whose different finish pushes the contacts along, finishing the circuit. 2.8. Web design The XAMPP software tool was used to create a Universal Research Locator (URL) and this link can be used by the user whenever to see their water consumption usage. 2.1. AVR Atmega 16 Atmega16 microcontroller of Atmega 16 Mega AVR family with low power consumption. Atmega 16 is based on the term Reduced Instruction Set Computing know as RISC and CISC Architecture, with 131 powerful instructions. By using this RISC based microcontroller we can execute many instructions in one machine cycle itself. Atmega16 will operate maximum at the frequency of 16MHZ. 2.2. ESP8266 ESP8266 is capable of functioning consistently in industrial environments, due to its wide operating temperature range. With highly integrated on-chip(IOC) features and minimum number of external discrete components and this on-chip provides many features like reliability, compactness and robustness. 2.3. Solenoid valve Solenoid valve (10) is a control unit which, when electrically energized or de-energized, either shut off or allow fluid flow. When energized, a magnetic field build up which pulls a plunger or pivoted armature against the action of a spring. When the opposite of above occurs(de- energized), the pivoted armature was return to its old position by the spring action. 2.4. Water flow sensor The (paddle flow meter) flow and the revolutions of the paddle wheel are proportional to each other. The paddle wheel will start to spin with the force from the flowing fluid and it becomes possible to measure the rate of this flow from the number of revolutions. By embedding a magnet in the rotation axis and on plates of the paddle, pulses will come is an 8-bit high performance © 2019, IRJET | Impact Factor value: 7.211 | ISO 9001:2008 Certified Journal | Page 20
International Research Journal of Engineering and Technology(IRJET) e-ISSN: 2395-0056 Volume: 06 Issue: 02 | Feb 2019 www.irjet.net p-ISSN: 2395-0072 Once our digital meter was started if check for the watch flow if the water flow was not detected then again it checks for the water flow and this check goes until the water flow was detected. Once the water flow was detected they send pluses to the AVR microcontroller and again the pulse flow data collected will be checked and if the data was not available again water flow will be detection will be done and once the pulse flow data was available the pulses are converted to liters per minute (LPM). If the LPM data was not available again the control goes to AVR micro controller and once the LPM data was available, the AVR microcontroller will communicate with real time clock (RTC) and ESP8266 and LCD to be connected same network if connection is not established then the control again goes to the AVR microcontroller. If the connection was established between AVR and ESp8266, then data send to MOTT server and in the website, we can also send SMS alert messages to our mobile phones also and if we needed can also see the data in the PC dashboard also if needed. Fig -3: webpage. 3. Functional Description Fig -5: Layout Diagram. 3. Existing system In existing method, the traditional water meter is used .so only one digital pulse will come out for every 100ltrs.so live monitoring is possible but it will have to simulated for every 24hrs manually and we can connect only maximum of 2 sensors with AVR Atmega 16 microcontroller and the open tap detection and no floe detected is not available in the existing method and also the day wise and consumption with billing is not available. Fig -4: Flow chart. © 2019, IRJET | Impact Factor value: 7.211 | ISO 9001:2008 Certified Journal | Page 21
International Research Journal of Engineering and Technology(IRJET) e-ISSN: 2395-0056 Volume: 06 Issue: 02 | Feb 2019 www.irjet.net p-ISSN: 2395-0072 Table -1: Existing technique tabulation. also we get the pulses out from it for every 2ml or 170 pulses/liters and hence we are able to provide day wise and monthly wise consumption of water comparison and bill can be given to promote more water conservation. If amount was not paid then termination of water flow will be done using solenoid valve. Hence this project can be used in Tamil Nadu e-government Water Corporation. Existing technique tabulation 2 minutes 5 minutes 10 minutes Volume of water received 4.5 liters 6.8 liters 12 liters 4.5 liters 6 liters 11.5 liters Volume of water expected Table -3: Proposed technique tabulation. Nil -0.8 -0.5 Proposedtechnique tabulation 2 minutes Error 5 minutes 10 minutes Volume of water received 5 liters 6.8 liters 13 liters 4.9 liters 6.8 liters 13 Volume of water expected 0.1 Nil Nil Error Chart -1: Existing system bar graph. Table -2: Existing technique specification. Existing technique specification Description specification Max.no of sensors that can be connected 2 Chart -2: Proposed system bar graph. No of pulse send out 1 pulse/100 liters Table –4 Proposed technique specification. Website development Software Tool PHP Proposed technique specification Description specification Frequency 1 MHZ Max.no of sensors that can be connected 2 Bit rate 9600 No of pulse send out 1 pulse/100 liters 4. Proposed system In the proposed method we can connect to 32 sensors with AVR Atmega 16 microcontroller and we are having the leakage detection. Open tap detection and no flow detection will be sent to our mobile phones using android based web application available and live monitoring is not needed to simulate for every 24 hrs. As in previous method we can make the live monitoring continuous lifelong. We are using hall effect-based water meter, so for minimum flow Website development Software tool PHP Frequency 1 MHZ Bit rate 9600 © 2019, IRJET | Impact Factor value: 7.211 | ISO 9001:2008 Certified Journal | Page 22
International Research Journal of Engineering and Technology(IRJET) e-ISSN: 2395-0056 Volume: 06 Issue: 02 | Feb 2019 www.irjet.net p-ISSN: 2395-0072 5. Performance analysis 3)Sharath V.C, Suhas S, Sachin Jain B.N and Vinay Kumar S.B “Smart Aqua Meter” Department of Electronics and Communication Engineering, School of Engineering and Technology, Jain University, Bangalore, India. A.In this proposed method, the AVRATmega16 microcontroller was used which will be operating at the frequency range of 16 MHz. 4)M. F. C. da Silva and D. P. Pereira, “System for measurement and control of water consumption using wireless sensor network,” in Computing System Engineering (SBESC), 2011 Brazilian Symposium on. IEEE, 2011, pp. 105–107. B.The data collected from this microcontroller will send to the cloud at the rate of 1,15,200 bits/sec. 6. Conclusions In our smart digital water based on the paddle flow sensor we can able to detect the water flow accurately than previous methods. In this method, we are going to provide leakage detect alert, open tap detection alert and no flow system alert. 5)A. Abu-Mahfouz and G.P Hancke, Energy Efficient Environment Monitoring System Based on the IEE 802.15.4 Standard for Low Cost Requirements,” IEEE Sensors Journal, Vol.14, No.8, pp.2557-2566, August 2014. will receive the SMS alert in our mobile phones. If needed, we can also view the result analysis data in the PC dashboard. We will see these alerts in 16x2 LCD display and, we 6)Sayonara A. C. Tavares, Ricardo J. B. V. M. Cavalcanti Diego R. C. Silva, Marcelo B. Nogueira and Marconi C. Rodrigues “Telemetry for domestic water consumption based on IoT and open standards” Escola de Ciˆencias e Tecnologia Universidade Federal do Rio Grande do Norte Natal, Rio Grande do Norte 59078-275. consumption of water. A URL link can also be given to view the 7)N.Adloan “A Microcontroller Based Power Utilities Tending Machine: Its Application to Sports Utility and Academic Instruction”2011. 8)S.P Borgatti and R. cross “A relational view of information seeking and learning in social networks” Management science vol. 49 no.4 pp. 432-445 2003. 9)Y.Park I.-H. Jo “”Development of the learning analytics dashboard to support students’ learning performance” J. Universal Comput. Sci. vol. 21 no. 1pp. 110- 133 2015. 10)Zhang Qiaobin Deng Wenge Xiafeng ZHANG. “Electromagnetic overflow mathematical model analysis of common rai pressure control valve” J. china ship research 2011 6(04) pp. 99-103. Fig -6: Result analysis of daily and yearly consumption. REFERENCES 1)S Botha, LA Meijsen, GP Hancke and BJ Silva “Design of a water flow and usage meter” Department of Electrical, Electronic and Computer Engineering, University of Pretoria, Pretoria, South Africa Corresponding author: 2)J.J. Clark “A magnetic field based compliance matching sensor for high resolution high compliance tactile sensing” proceedings. 1998 IEEE Int. Conf. Robot. Autom. 1998. © 2019, IRJET | Impact Factor value: 7.211 | ISO 9001:2008 Certified Journal | Page 23