Download
1 / 28
280 likes | 715 Vues
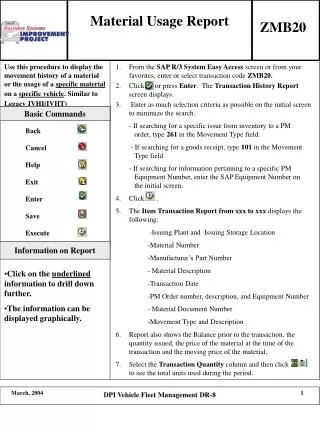
Rail Usage Factual Evidence Report. 14 th August 2009. Background and Objectives.

E N D
Rail Usage Factual Evidence Report 14th August 2009
Background and Objectives • Southeastern plan to cut 18 peak and off peak weekday train services and all weekend services from and to the Affected Areas* from and to the City** from December 2009. As a result, the Affected Areas will not have rail services to the City • The cancellation of the train services is of great concern to the community in the Affected Areas as it will have an impact on the development of the area, house prices and future investment. Furthermore it will have an impact on the London economy. A petition to the Prime Minister in Number10.gov.uk was signed by more than 1200 people • Following a meeting with the Department for Transport (DfT) it became clear that appropriate usage and demand figures for rail services into the City from the Affected Areas were not available. It was agreed that the final decision on the revised timetable be delayed by six weeks to enable additional data to be collected • This report outlines research findings compiled by the Malling and District Rail Travellers Association and the Maidstone Area Rail User Group in relation to their Keepourtrains campaign, that show: (i) the current demand; and (ii) the concealed demand for train services from and to the Affected Areas into the City • The surveys undertaken in connection with this report were conducted during July, traditionally a period of reduced usage * The Affected Areas referred to includes Maidstone, Barming, East Malling, West Malling, Kings Hill Borough Green, Larkfield, Snodland, Leybourne and Kemsing and all the surrounding areas ** The planned cuts affect train services between Maidstone East and London Bridge, London Cannon Street and London Charing Cross
The Report • The report includes: • “The Current Demand Survey” • A manual passenger count of peak-time and off-peak services from and to the Affected Areas from and to the City • Objective: to show the current demand for the services • This was carried out during July, a period of reduced usage • 73 trains were counted • Passengers on the trains were counted by volunteers • Counts were taken on the train: after the train had left the last stop between the Affected Areas and London; and after the train had left the last stop between London and the Affected Areas (e.g. 08:53 from Maidstone to Charing Cross, count after train left West Malling; 19:14 from Cannon Street to Maidstone, count after train left London Bridge) • “The Concealed Demand Survey” • A survey of train users from the Affected Areas • Objective: to show that if the services between the Affected Areas and the City were not so poor there would be significantly greater demand • Research was carried out online between July 9th and August 3rd • 496 respondents completed the survey
Understanding the Affected Areas Planned service cuts affect train services between Maidstone East and London Bridge, London Cannon Street and London Charing Cross These cuts impact all commuters on the Maidstone East line; these include, amongst others, commuters from Bearsted, East Malling, West Malling, Snodland, Larkfield, Leybourne, Borough Green, Ightham, Kings Hill, Aylesford, Kemsing and surrounding areas
Affected Areas as a Growth Point • Maidstone has been designated as: • a growth point by the Government • a transport hub in the South East Plan • As part of the growth plan, between 2006 and 2026 Maidstone will need to accommodate: • 11,080 additional dwellings • Between 5-10,000 additional jobs • There are current plans to build around 5,000 extra dwellings in Kings Hill and the surrounding areas in the next 5 years • Maidstone is the only major town in the county to have a proposed reduction in services • Maidstone is the county town of Kent • West Malling station is the fastest growing station in the South East of England (source: Passenger Focus)
Disproportionate Poor Services to the City from and to the Affected Areas • The population figures demonstrate the spread of Kent’s population. The distribution of train services is not so even • The proposed timetable will put further strain on other lines as commuters are likely to drive to stations with better services to the City • Direct morning services* • Maidstone: 3 • Gillingham: 12 • Tonbridge: 19 In one car- park, 101 parking spaces (40%) are occupied by commuters from the Affected Areas There is one car park with a 3 year waiting list • Based on Office National Statistics 2001 Census Data • Direct morning services to the City are those that depart before 8:53 • Current services into the City and the current timetable do no take into account the significant population growth in the Affected Areas since 2001. In particular, the population growth and significant investment in Kings Hill
Trains into the City - Disparity of Services • London Bridge is a key station for all City commuters. The vast majority of trains into Cannon Street stop there and it is the primary London terminus in the south east of London for connections with the underground to Canary Wharf • The first direct train to London Bridge from Maidstone departing from Maidstone East is the 08:53, stopping at West Malling at 09:01 and arriving at London Bridge at 09:39 • All journeys to London Bridge prior to the above require one or two changes - either Otford/Sevenoaks or, in Maidstone's case, Paddock Wood • The average journey time from Maidstone to London Bridge in the morning is 85 minutes, and 70 minutes from West Malling • The only direct trains to a London terminus close to the City are the 06:15 and 06:52 Maidstone East services to London Blackfriars. Both trains stop at West Malling at 06:23 and 07:03 respectively. Neither stop at London Bridge and these trains are slow services • By contrast, prior to 08:53 there are 19 direct trains from Tonbridge to London Bridge. The first train departs at 04:56 and the average journey time is 39 minutes • In north Kent, prior to 08:53 there are 12 direct trains from Gillingham to London Bridge. The first train departs at 05:22 and the average journey time is 55 minutes * All train times are taken from the National Rail accredited website – www.thetrainline.com
Trains from the City – Disparity of Services(between 16:29 and 19:36) • There is only one direct service from London Bridge to West Malling and Maidstone (Maidstone East). This is the 19:14 Cannon Street service. • The average journey time from London Bridge to Maidstone for journeys started during this time is 81 minutes. • The average journey time from London Bridge to West Malling for journeys started during this time is 69 minutes • All other journeys during this time involve one or two changes, predominantly at Sevenoaks/Otford or, in Maidstone's case, Strood or Paddock Wood • By contrast, there are 17 direct services from London Bridge to Tonbridge with an average journey time of 36 minutes • There are 11 direct services from London Bridge to Gillingham with an average journey time of 62 minutes
Demand for Rail Services from and to the Affected Areas has Increased Considerably • Based on station entry and exit figures for 2006-7 and 2007-8 obtained from Passenger Focus • Cancellation of services does not make sense when the stations in the Affected Areas are some of the fastest growing station in the South East of England
Current UsageDemand vs. Concealed Demand Figures in this section are based on a manual passenger count during July (typically a period of reduced usage). Figures shown are averages of the counts undertaken. Where there are gaps this is because we were unable to carry out a count for that train* The report also refers to 2005 data from the Strategic Rail Authority * The survey was done by volunteers and was undertaken without any financial support from any other organisation. The survey was conducted in a very limited time window
Train Usage Throughout the Day – Mean Scores Travelling to London Travelling from London • Based on passenger counts – where no data is recorded, no trains were sampled • Survey done in July a period of reduced usage (Passenger Focus estimates that usage during this period is around 15-20% lower) • See Appendix 1
Train Usage Throughout the DayThe current demand survey demonstrates clear periods of increased demand on services arriving in London by 10am, and departing London after 4pm • Based on passenger counts and showing ‘smoothed line’ with approximated figures replacing blanks
Train Usage Throughout the DayFigures from our count broadly reflect the usage patterns recorded by the SRA, although the SRA chart below demonstrates that usage at 16:30 and 19:00 is around half that of the peak. The red squares on the chart indicate the times of the trains with the heaviest passenger loads between West Malling and London Bridge – these are the trains closest to peak usage periods, but are between one and two hours before or after the peak time, with no fast London Bridge service during the peak time. • Figure 3 from London Area Travel Survey by the Strategic Rail Authority (Feb 2005)
Concealed Demand Survey An online survey was completed by 496 commuters. The sample was recruited through word of mouth, online invitations and links through rail users websites. The sample is not representative of all commuters or all citizens. However, it provides a good indication of commuter demand in the area
Nearest Station Of these, 69% usually commute from the station closest to where they live. 31% have to travel to another station Q1 – What is the name of the main train station nearest to your home? Base: All (496 respondents)
Station Commence Journey Demonstrates commuters travelling to stations beyond easy reach. Q2 – What is the name of the station that you start your journey from into London Base: All (496 respondents)
Commuters Travelling to Stations Beyond Easy Reach Q2 – What is the name of the station that you start your journey from into London
Environmental Impact Stations people travel to (in miles) (in miles) 79 people Average round trip distance is 41.10 miles from West Malling Average trip emissions per round trip are 13.5 CO2 Kg Average round trip distance is 39 miles from Maidstone Average trip emissions per round trip are 13.5 CO2 Kg If commuters from the Affected Areas start travelling to other stations as a result of the planned service cancellations the CO2 emissions will increase significantly. This is of great concern to Local Councils. It will also be against Government policy to reduce CO2 emissions. The Government has pledged to reduce CO2 emissions by 34% by 2020 CO2 emissions can be reduced significantly if there were better rail services from and to the City (see above 95% of respondents stated that they will travel from their local stations if there were better services) Data in relation to mileage and CO2 emissions obtained from RAC Route Planner. Data rounded to closest decimal point (i.e. under 1.4 to 1 and over 1.5 to 2)
Reason Why Not to Travel From Local Station 4 out of 10 respondents gave one of the following reasons for why they travel from a station other than their nearest station – this suggests a clear demand for improved services into the city • Other reasons include: • Limited parking • Number of stops • Tube links at destination (6% of respondents travel to Victoria and then take the tube to the City) Q3 – If applicable, why do you commute to London from a station other than your local train station?? Base: Those who state a reason why they use an alternative (195 respondents)
Closest Station to Destination 80% of respondents say that they work close to these stations Only 7% of respondents say Victoria is the closest station to their destination Q4 - What London station is closest to your final destination? Base: All (496 respondents)
Passenger Choice? Only 5% of respondents would commute into London from Ebbsfleet on the high speed rail link 97% of respondents would use their local station if there were better services to their final destination Q5 – Would you use your local station if there were better services from there to your destination? Q6 - Would you commute into London from Ebbsfleet on the high speed rail link? Base: All (496 respondents)
Costs and Implications This section highlights calculated costs in terms of time and money
Time and Cost Implications if Current Trains are Cancelled Extra time per day: 38 minutes - Additional cost per day: £3.20 Cost of Travel Card West Malling to London Terminals £3,080 per year Estimated Daily Cost The additional daily cost for a commuter will be £3.20 per day assuming the individual holds an Oyster card* Estimated Time Using Current Services: (West Malling to London Bridge) Travel time to/from West Malling to City (9:01 and 19:14 services) = 38 mins per journey (Total: 106 mins per day) Using Victoria: (West Malling to London Bridge) Travel time from West Malling to Victoria = 57 mins per journey (114 mins per day)Travel time from Victoria to London Bridge = 14 mins per journey** ( 28 mins per day) (Total: 142 mins per day) Notes: • Victoria underground is already overcrowded and at peak times the access gates are closed. There has not been a proper consultation with London Underground and in particular Victoria Station to analyse the impact that the cancellation of the current trains will have • Trains from Victoria station to West Malling are slow services taking on average 55 minutes to West Malling • Blackfriars underground station is closed. This is also a major problem for people that work in the City * If the individual does not hold an Oyster Card the daily cost will be £8** Actual journey times only. Assumes that there is no waiting time for the tube
Estimated Daily Cost The additional daily cost of using Ebbsfleet International for August, assuming that you have a Southeastern ticket that already covers you to a London Terminus. Travel from West Malling to Ebbsfleet and return circa 36 miles per day Assume mileage at 42 pence per mile £15.12 per day (Inland Revenue Rates) NCP Daily Car Parking at Ebbsfleet £8.00 per day Additional Fare (Borough Green and West Malling) £40.50 / 5 = £ £8.10 per day Underground fares £3.20 per day Total Daily Cost £34.42 Estimated Time Using Current Services: (West Malling to London Bridge) Travel time to/from West Malling to City (9:01 and 19:14 services) = 38 mins per journey (Total: 76 mins per day) Using Ebbsfleet: (West Malling to London Bridge) Travel time from West Malling to Ebbsfleet = 40 mins per journey (80 mins per day)Travel time from Ebbsfleet to London St Pancras = 17 mins per journey (34 mins per day) Travel time from St Pancras undergound to London Bridge = 15 mins per journey* (30 mins per day) (Total: 144 mins per day) Ebbsfleet – Time and Cost Implications Extra time per day: 68 minutes - Additional Cost per day: £34.42 *Actual journey times only. Assumes that there is no waiting time for the tube
Ebbsfleet – Time and Cost ImplicationsNotes on Calculations • The calculations shown are based on Southeastern preview fares and services for Ebbsfleet, for passengers that currently commute to/from West Malling • The calculations show the time and cost implications of using the Ebbsfleet High Speed Rail Link and are based on the published ADDITIONAL fares payable • The additional fare payable to use this service is an extra £40.50 per week from both Borough Green and West Malling, compared to £18.90 from Ashford and £21.30 from Chatham or Gillingham • Map Quest was used as an indicator of distance and time, which doesn’t take into account rush hour traffic. Vehicle costs are based upon Inland Revenue rates for car travel, which include fuel, car insurance, depreciation, wear and tear etc. This demonstrates the average real cost of running a car with a two litre engine or less. Vehicles with a larger engine size would have a higher cost and carbon emissions would increase.
Executive Summary Current Demand Survey There is clear evidence that there is a significant demand for train services from and to London Bridge, Cannon Street and Charing Cross from the Affected Areas Concealed Demand Survey The results from the survey show that there is a significant number of people using a station other than their local station People are travelling as far as London because of the lack of proper services to and from the Affected Areas to and from the City 97% of respondents would use their local station if there was a better service to the City 80% of respondents' say London Bridge (25%), Cannon Street (39%) ond Blackfriars (16%) are the closest stations to their destination. Only 7% of respondents say Victoria is the closest station to their destination Cancelling the current services will have a significant impact on traffic and pollution levels * 8:53 from Maidstone; 16:14 from Cannon Street; and 19:14 from Cannon Street