Download
1 / 17
170 likes | 344 Vues
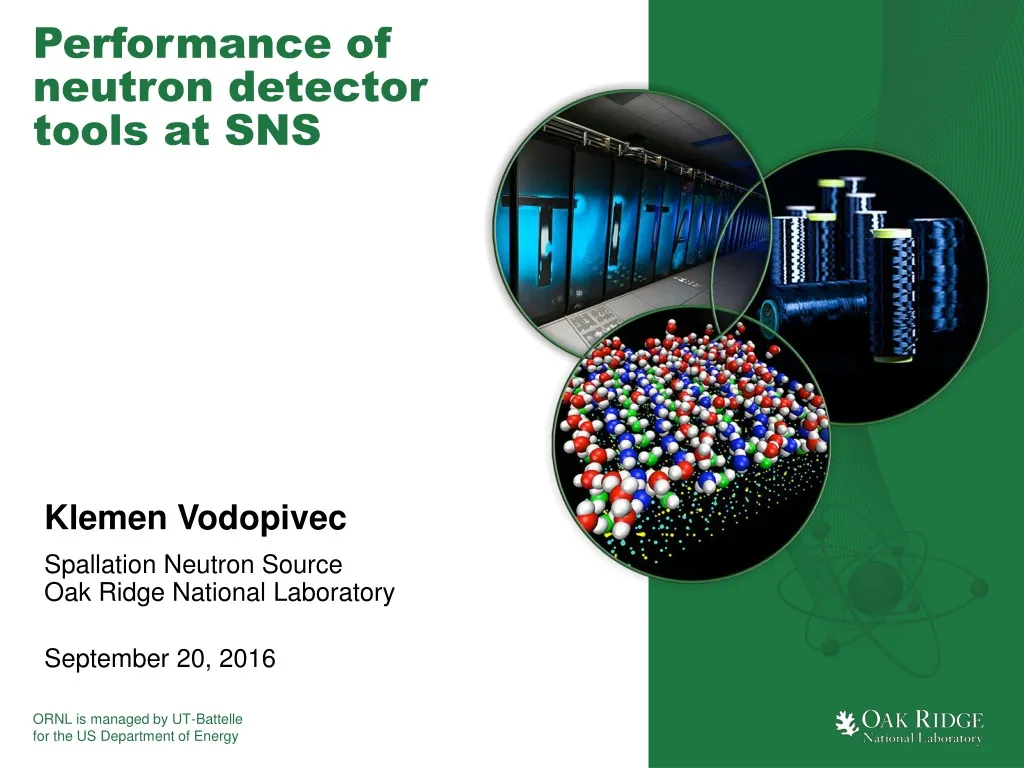
Performance of neutron detector tools at SNS. Klemen Vodopivec. Spallation Neutron Source Oak Ridge National Laboratory. September 20, 2016. Overview. Python for calibration & diagnostics Data rates, structured data format Optimization. Detectors d ata flow. Data acquisition.

E N D
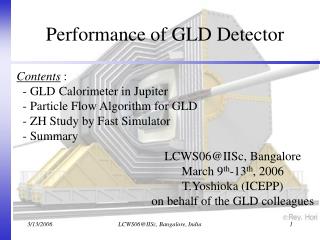
Performance of neutron detector tools at SNS Klemen Vodopivec Spallation Neutron SourceOak Ridge National Laboratory September 20, 2016
Overview • Python for calibration & diagnostics • Data rates, structured data format • Optimization
Detectors data flow • Data acquisition LVDS/optics • Calibration & diagnostics • Live display • Data reduction Custom TCP/IP EPICSv4 EPICSv4
Detector diagnostics use cases • Detect malfunctioning • Optimization • Monitoring • Pre-processing verification
Detector diagnostics requirements • Python • Matplotlib plotting • Run on demand • Usually requires well-known sample • 100+ detectors simultaneously • CA for setup, PVA for data
Data rates (cross fiber detector) • Data modes • Production – 8 bytes per event • Diagnostic – 48 bytes per event • Typical rates – 1000 events/s per detector • Number detectors – 30-40 • Max data rate – 1.5MB/s
Data rates (He3 tube detectors) • Data modes • Production – 8 bytes per event • Diagnostic – 20 bytes per event • Typical rates – 10k – 500k events/s per detector • Number detectors – 10-120 • Max rate – 100MB/s
Python struggle • Data receive – approx 50% CPU • Big custom structure unpacking • High update frequency – small packets • Data processing – approx 30% CPU • GUI – 15% CPU • Max data rate – 1000 ev/s for cross fiber detectors
The (obvious) solution – cont’d Python C extension • PVA data • Receive using EPICS v4.5 C++ API • Unpack • Generate plot data • Plot-ready data • numpy array • Detectors setup • C extension init • GUI • Matplotlib • PyQT
Results • Higher throughput • Easily 30+ cross fiber detectors • Multi-threaded receive & processing • Robustness • Potential for other detector types