Download
1 / 8
80 likes | 531 Vues
Trend in Prescription Drug Abuse. In 2004, 19.1 million Americans were current illicit drug users (7.9% of the U.S. population) 1 Nonmedical use of prescription pain relievers was the illicit drug category with the largest number of new abusers (2.4 million) 1

E N D
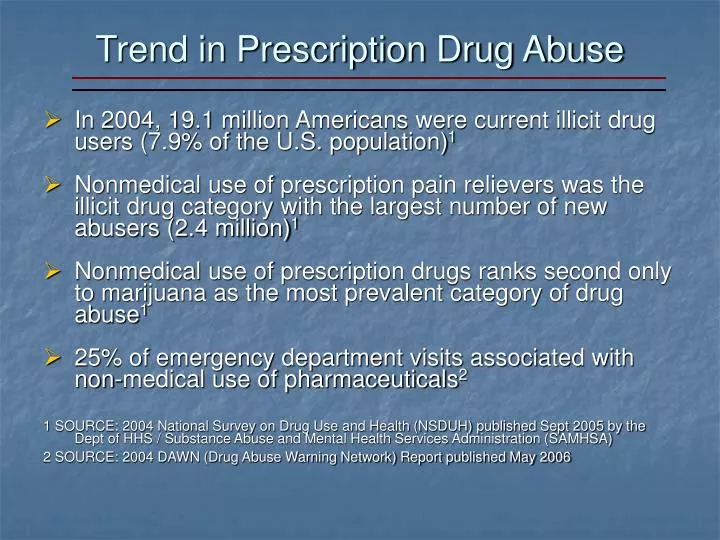
Trend in Prescription Drug Abuse • In 2004, 19.1 million Americans were current illicit drug users (7.9% of the U.S. population)1 • Nonmedical use of prescription pain relievers was the illicit drug category with the largest number of new abusers (2.4 million)1 • Nonmedical use of prescription drugs ranks second only to marijuana as the most prevalent category of drug abuse1 • 25% of emergency department visits associated with non-medical use of pharmaceuticals2 1 SOURCE: 2004 National Survey on Drug Use and Health (NSDUH) published Sept 2005 by the Dept of HHS / Substance Abuse and Mental Health Services Administration (SAMHSA) 2 SOURCE: 2004 DAWN (Drug Abuse Warning Network) Report published May 2006
4.7 million In 2005, 6.4 million Americans Age 12+ used a prescription drug for non-medical purposes in past month Sedatives 0.3 million 1.1 million Stimulants 1.8 million Anti-Anxiety Medication Narcotic Pain Relievers SOURCE: 2005 National Survey on Drug Use and Health (NSDUH), published Sept 2005 by Dept of HHS / Substance Abuse and Mental Health Services Administration (SAMHSA)
2005 Partnership and Attitude Study (PATS)* • Alarming number of teens have a false sense of security about the safety of abusing prescription medications • 19% of teens report abusing prescription medications to get high • 40% believe that prescription medicines are “much safer” to use than illegal drugs • 31% believe there’s “nothing wrong” with using prescription medicines without a prescription “once in a while” • 29% believe prescription pain relievers are not addictive *18th annual study of teen drug use and attitudes Released in April 2006 by The Partnership for a Drug-Free America
Methods of Diversion • Rogue Internet “Pharmacies” • Inappropriate prescribing • Illegal sales • Employee theft • Prescription rings • Doctor shopping • Fraudulent prescriptions • Pharmacy theft • Foreign diversion and smuggling into the U.S. • “Pharming”
Hydrocodone • Vicodin®, Lortab®, Lorcet® • DEA Diversion Drug Trend Report identifies hydrocodone as the most commonly diverted and abused controlled pharmaceutical in the U.S. • 2004 – United States used 99% of the global hydrocodone supply* • Approximately 125 million hydrocodone prescriptions were dispensed in U.S. in 2005** * 2005 INCB report **IMS data
Hydrocodone Situation Hydrocodone products are the most frequently prescribed drug in the U.S. Comparable 2005 data shows that hydrocodone was prescribed three times more frequently than any other controlled substance* Hydrocodone is the most frequently encountered pharmaceutical in submissions of evidence to federal, state and local labs** DAWN 2005 data– from 2004-2005 emergency department visits involving nonmedical use of opiate/opioid pain medications increased 24% overall The Aggregate Production Quota for hydrocodone has increased 100% since 2000 (21,417 kg to 42,000 kg) * RxList data * * STRIDE / NFLIS data
Prescription Drug Trends Number of Hydrocodone Prescriptions* Top Five Prescription Drugs Sold in the U.S.* (By Number of Prescriptions Sold) 112,380 +7.9% +8.5% +1.1% -1.4% +1.3% +15.1% +27.8% +11.5% +5.5% +7.5% (cholesterol) (blood pressure) (antibiotic) (diuretic) (pain reliever) • Hydrocodone in combination with acetaminophen is the #1 prescribed drug in the U.S. • The U.S. has only 4 percent of the world’s population, but consumed 99% of the world’s supply of hydrocodone in 2004. • One in 10 high school seniors have admitted to abusing hydrocodone in 2006 (MTF). • SOURCE: IMS prescription data. Note: Percentage change from the number of prescriptions sold in the previous years. Revised May 24, 2007 Source: Drug Topics, Rx List * Prescription data is from two separate prescription monitoring sources.
Comparison of CY2006 Purchases of Hydrocodone by Pharmacies Based on what an average pharmacy dispensed in 2006, it would take the entire annual sales from 1,118 pharmacies to equal the same volume these 34 rogue pharmacies did in 2006. Total # DEA Registered Pharmacies 61,714 TOTAL DOSAGE UNITS PURCHASED * Based on 34 Known and Suspected Internet Pharmacies Date Prepared: 03/07/2007 Source: ARCOS