Download
1 / 60
600 likes | 741 Vues
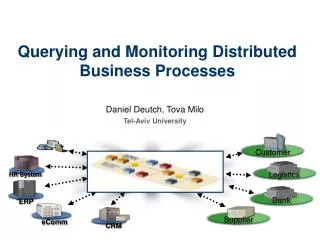
Managing Business Processes: Design and Improvement. Cheng Li, Ph.D. California State University, Los Angeles January 2002. Contents. Basic Concepts Background, definitions, process structure, and generic approaches to process design Process Design & Improvement Approaches

E N D
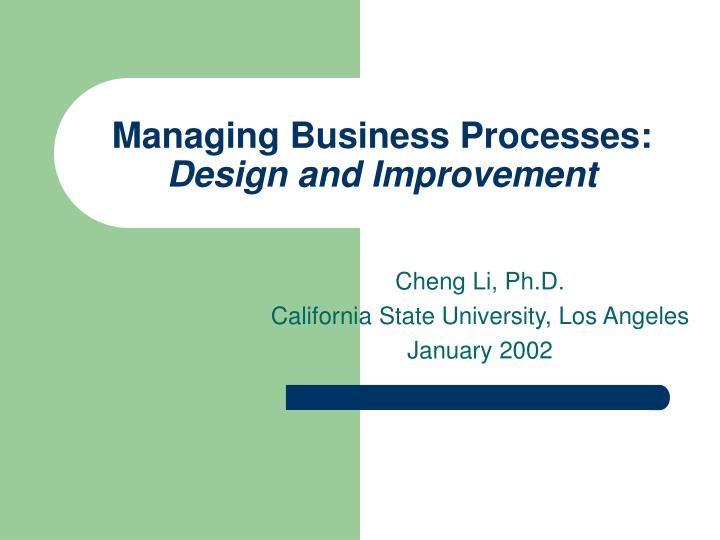
Managing Business Processes: Design and Improvement Cheng Li, Ph.D. California State University, Los Angeles January 2002
Contents • Basic Concepts • Background, definitions, process structure, and generic approaches to process design • Process Design & Improvement Approaches • The four phases of process improvement projects, TQM, and Reengineering • Process Design & Improvement Techniques • Flowcharting, QFD, SPC, queuing, and information modeling
The Process Focus • The changing emphasis of management practices: from individual activities to process • Background: • Local optimization is not inadequate. • Activities are increasingly integrated.
What is the business process approach? • A work process: a set of related activities that adds value and provides a service to a customer. • The process focus: • integrative • cross-functional • customer orientation
What is business process improvement? • Process Improvement: how to do our work better in terms of customer satisfaction, cost reduction, and self-fulfillment, etc. • Related Process Management Theories: • Reengineering (Michael Hammer) • Continuous improvement or TQM • BPI: Business Process Improvement (James Harrington)
Strategic Positioning through Process Structure • Complexity: • e.g. preparation process: fast food vs. gourmet food • Divergence: degree of customization, the amount of discretion or freedom allowed • e.g. H&R Block vs. CPA firms • e.g. Options for Mercedes vs. for Camry
Competitive Advantages through Process Structure • Competitive Advantages • Competitive Strategies • e.g. Sam’s Club vs. Nordstrom • layout, selection, service process, personnel • Competitive Strategy and Structural Positioning
Example: Structural Alternatives for a Family Restaurant Current take reservation seat guests, give menus Serve water and bread Take orders Prepare orders: salad (4), entrée (15) Higher specific table selection recite menu, describe entrees and specials assortment of hot breads at table, taken personally individually prepared Lower • no reservations • self-seating, menu on board • customer fills out form • pre-prepared, no substitute, limited to 4 choices
Generic Approaches to Service System Design • Production Line Approach • limited Discretionary Action of Personnel • division of labor • substitution of technology for people • service standardization
Generic Approaches to Service System Design • Customer as Coproducer • substitution of customer labor for provider labor • smoothing service demand
Generic Approaches to Service System Design • Customer Contact Approach • Degree of customer contact • Separation of high- and low-contact operations
The Four Phases of Process Improvement • Description • Analysis • Design • Implementation
Process Description • Customers • Activities • Primary (value-adding) activities • Supporting (non-value-adding) activities • Work flow • Policies and constraints • Output: process flowcharts & description
Process Analysis • Identify potential improvement areas • sources of information: internal and external • problems and causes • Identify related work processes and prioritize improvement projects • Output: major problems, causes of the problems, targeted work processes
Process Design • Customer requirements • e.g. telephone repair: short down time, when it can be repaired, convenient hours, short waiting time • Design parameters • e.g. telephone repair: training of the operators, computer systems, # technicians • Relationships between requirements and parameters
Process Design (cont.) • Generating ideas • Evaluating alternatives • Designing the new process • Setting policies and controls • Other issues: feedback mechanism, justification of the new process
Implementation • Planning • Work process changes • Policy changes • Organizational changes • Training • Promotion and education
TQM/Continuous Improvement • The Concept of Total Quality • The Dynamics of Quality Improvement: continuous improvement vs. tradeoff balancing • Employee Involvement • Emphasis on Customer Satisfaction • Evolution
Reengineering • Redesign: “forget about what you know” • Application of new technology • Break the routine (“a revolution”): • habits • assumptions • values
Reengineering: Assumption Busting • Problem: a specific performance shortcoming of the process • Rule: A specific aspect of the process design that causes the problem • Assumption: a belief about the environment that gives rise to the rule
Reengineering: Assumption Busting Example: • Problem: Customers don’t know when the repair can be done. • Rule: The operator does not have the authority to schedule technicians. • Assumption: The operator does not know where the problem is and does not have information about technicians’ schedules.
Overcoming Resistance to Change • Resistance is natural and inevitable: expect it • Resistance doesn’t always show its face: find it • Resistance has many motivations: understand it • Deal with people’s concerns rather than their arguments: confront it • There’s no one way to deal with resistance: manage it
The Key Mechanisms for Overcoming Resistance • Incentives: positive and negative • Information: dispel uncertainty and fear • Intervention: one-on-one connections • Indoctrination: make change seem inevitable • Involvement: make people part of the effort
The Ten Principles of Communications • Segment the audience • Use multiple channels • Use multiple voices • Be clear • Communicate, communicate, communicate
The Ten Principles of Communications (cont.) • Honesty is the only policy • Use emotions, not just logic • Heal, console, encourage • Make the message tangible • Listen, listen, listen
Basic Techniques: Process Flowchart • e.g. student registration process • get a copy of class schedule • select classes, consult advisor if necessary • make payment • wait for authorization: pin number, time window • call the system • register, etc.
Process Flowchart: symbols Action/Operation Decision (If …) Delay Transportation
QFD: Quality Function Deployment • Example: a relationship matrix
Statistical Process Control • Emphasis on the process instead of the product/material • Focus on “prevention”
Abnormal variationdue to assignable sources Out ofcontrol UCL Mean Normal variationdue to chance LCL Abnormal variationdue to assignable sources 0 1 2 3 4 5 6 7 8 9 10 11 12 13 14 15 Sample number Control Chart
1 2 3 4 In-Control: random only UCL LCL Sample number
Control Charts for Variables • Mean Chart: measuring sample means • Range Chart: measuring sample ranges i.e. max-min
UCL x-Chart LCL UCL LCL Out-of-Control: assignable & randomshifted mean process mean is shifting upward Sampling Distribution Detects shift Does notdetect shift R-chart
UCL Does notreveal increase x-Chart LCL UCL Out-of-Control: assignable & randomincreased variability Sampling Distribution (process variability is increasing) R-chart Reveals increase LCL
a/2 a/2 Mean LCL UCL a = Probabilityof Type I error Type I Error:
Mean Type II Error: In-Control Out-of-Control LCL UCL
Control Charts for Attributes • p-Chart - Control chart used to monitor the proportion of defectives in a process • c-Chart - Control chart used to monitor the number of defects per unit
Counting Above/Below Median Runs (7 runs) B A A B A B B B A A B Counting Up/Down Runs (8 runs) U U D U D U D U U D Counting Runs Figure 10-11 Figure 10-12
LowerSpecification UpperSpecification Process variability matches specifications LowerSpecification UpperSpecification Process variability well within specifications LowerSpecification UpperSpecification Process variability exceeds specifications Process Capability
Process Capability: 3-sigma & 6-sigma Upperspecification Lowerspecification 1350 ppm 1350 ppm 1.7 ppm 1.7 ppm Processmean +/- 3 Sigma +/- 6 Sigma
Other Quality Management Tools • Check sheet • Scatter diagram • Histogram (frequency) • Pareto chart • Control chart • Cause-and-effect diagram
Processing order Arrivals Waiting line Service Exit System Queuing Systems: basic elements
Queuing Systems: multiple phases Multiple channel Multiple phase
Modeling with Queuing Theory • System Characteristics • Population source: finite, infinite • No. of servers • Arrival and service patterns: e.g. exponential distribution for inter-arrival time • Queue discipline: e.g. first-come-first-serve
Measuring Performance • Performance Measurement: • System utilization • Average no. of customers: in line and in system • Average waiting time: in line and in system • e.g. infinite source, single server, exponential inter-arrival and service times, first-come-first-serve: (see handout)
Basic Tradeoff Total cost Customer waiting cost Capacity cost = + Total cost Cost Cost of service capacity Cost of customers waiting Service capacity Optimum
Basic Tradeoff (cont.) Average number on time waiting in line 0 100% System Utilization