Download
1 / 104
1.04k likes | 1.29k Vues
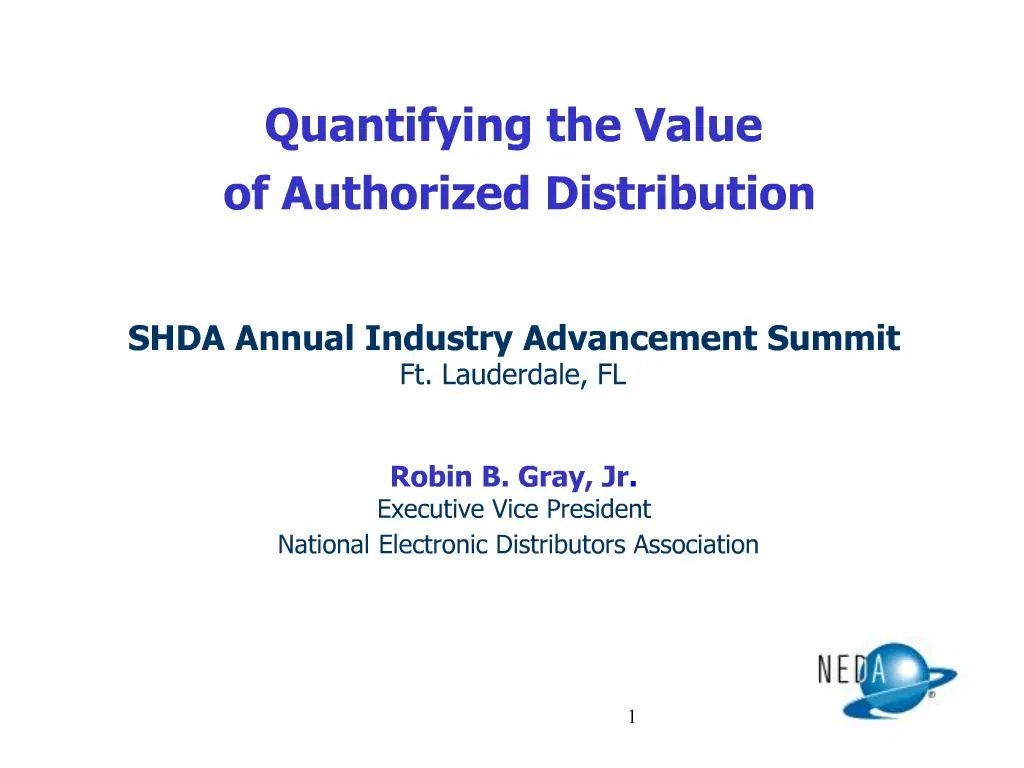
2. Presentation OverviewBackgroundAbout the StudyAbout the CalculatorsCase StudyQuestion

E N D
1. 1
2. 2
3. 3
4. 4
5. 5
6. 6
7. 7
8. 8
9. 9 Value Categories Inventory
Common to all but measured differently.
Convenience Costs
Customer Focused
Sales Effort
Supplier Focused
Credit for Small Customers
Supplier Focused
10. 10 Holding Costs Opportunity Cost of Capital
WACC
9-13% estimated by participants and financial community
12.5% used in study
Gross Margins
15 � 40 %
Hurdle Rates
40 � 60%
11. 11 Holding Costs Storage Costs
World Class Distribution (Low) � 15%
Average � 20%
High � 25%
Obsolescence Costs
1 to 9% reported by participants
Best in class participants
Insurance and Taxes
1 to 4%
12. 12 Relationship Between Inventory and Capacity Planning Higher capacity utilization leaves the customer and supplier with less flexibility:
The customer requires high fill rates since stockouts will risk shutdowns.
Suppliers will have less ability to changeover lines making flexibility in delivery sizes more expensive.
In recent years, suppliers have faced an over abundance of capacity leading to poor decisions on going direct.
Stems from an inability to understand the cost of distribution services as compared with capacity economies of scale.
13. 13 Inventory Types The calculator decomposes inventory into:
Regular Inventory � Inventory that moves � associated with order size.
Demand During Lead Time Inventory
Order Size
Safety Stock � Inventory that does not move � associated with risk of stockout.
Fill Rate
Forecast Error
Lead Time Variability
14. 14
15. 15
16. 16 Distributors handle many small customers at higher risk levels.
Higher DSO than distributors.
Calculator brings to picture the additional cost of administration and the difference in opportunity costs and accounts receivables.
17. 17
18. 18
19. 19
20. 20
21. 21
22. 22
23. 23
24. 24
25. 25
26. 26
27. 27
28. 28
29. 29
30. 30
31. 31
32. 32
33. 33
34. 34
35. 35
36. 36
37. 37
38. 38
39. 39
40. 40
41. 41
42. 42
43. 43
44. 44
45. 45
46. 46
47. 47 Supplier Categories
48. 48 Sales Effort Savings
49. 49 Inventory Savings - I
50. 50 Inventory Savings - II
51. 51 Extended Credit Savings
52. 52 Example Supplier Data
53. 53
54. 54
55. 55
56. 56
57. 57
58. 58
59. 59
60. 60
61. 61
62. 62
63. 63
64. 64
65. 65
66. 66
67. 67
68. 68
69. 69
70. 70
71. 71
72. 72
73. 73
74. 74
75. 75 Case Study
76. 76 Case Study Introduction
Channel Strategy
NEDA Supplier/Customer Calculator
Supplier Analysis
Customer Impact
Summary
77. 77 Direct vs. Distribution
78. 78 If we define our Business Cycle as Creating Demand, Capturing Demand and Fulfilling Demand.
A Channel Strategy answers the Question of, Who Owns which piece of the Demand Creation, Capture and fulfillment Process at which tier of customers.
Where does it makes sense to collaborate?
The Strategic Question is, Who Owns which piece of the Demand Creation, Capture and fulfillment Process at which tier of customers.
Where does it makes sense to collaborate?
If we define our Business Cycle as Creating Demand, Capturing Demand and Fulfilling Demand.
A Channel Strategy answers the Question of, Who Owns which piece of the Demand Creation, Capture and fulfillment Process at which tier of customers.
Where does it makes sense to collaborate?
The Strategic Question is, Who Owns which piece of the Demand Creation, Capture and fulfillment Process at which tier of customers.
Where does it makes sense to collaborate?
79. 79 A Channel Strategy, e-enabled or not has Three elements:
-Customer Tiers
-Product Lifecycle
-The Combination of the two
First with regards to the Customer element, Taking our simplified Sales Process Overlaid with the Three Tier of Customers which is common in our Industry How much Bandwidth does a manufacturer have for which customers..
A Channel Strategy, e-enabled or not has Three elements:
-Customer Tiers
-Product Lifecycle
-The Combination of the two
First with regards to the Customer element, Taking our simplified Sales Process Overlaid with the Three Tier of Customers which is common in our Industry How much Bandwidth does a manufacturer have for which customers..
80. 80 Company (as well as our industry) product Offering consists of break thru
products aimed at a few Industry leaders as well as older discrete diodes for the masses. This year we massively reorganized our sales resources towards the front of the product life cycle. We bet our resales that our Channel Strategy for the maturing products would provide for our continues success. Company (as well as our industry) product Offering consists of break thru
products aimed at a few Industry leaders as well as older discrete diodes for the masses. This year we massively reorganized our sales resources towards the front of the product life cycle. We bet our resales that our Channel Strategy for the maturing products would provide for our continues success.
81. 81 Understanding which part of the matrix one is targeting the channel strategy is the first step in evolving your strategy to the evolving needs of the marketplace.Examples give.Understanding which part of the matrix one is targeting the channel strategy is the first step in evolving your strategy to the evolving needs of the marketplace.Examples give.
82. 82 Examples Such as a Co-Development on with a Major Handset Manufacturer vs LEDs bought for a College Project.Examples Such as a Co-Development on with a Major Handset Manufacturer vs LEDs bought for a College Project.
83. 83 Throughout the 90s manufacturers have been moving their most expensive demand creation and captures resources to the front of the product life cycle curve. We belatedly but aggressively are making this move.
We plan to free up local people resources to apply to the Front of our Product Lifecycles with the leaders in the industry. Free up the Cash in our Supply chain to fund R-DThroughout the 90s manufacturers have been moving their most expensive demand creation and captures resources to the front of the product life cycle curve. We belatedly but aggressively are making this move.
We plan to free up local people resources to apply to the Front of our Product Lifecycles with the leaders in the industry. Free up the Cash in our Supply chain to fund R-D
84. 84 Can we quantify change? Moving Roughly 500 Direct Customers and $4M to distribution
Customers see no impact in price
Can company quantify savings to financially rationalize the distributor margin?
85. 85
86. 86
87. 87
88. 88
89. 89
90. 90
91. 91
92. 92
93. 93
94. 94 Case #2 One $500K Customer with various safety stock logistic Needs:
95. 95
96. 96
97. 97
98. 98
99. 99
100. 100
101. 101
102. 102
103. 103 Summary Results: Value of Distribution Varies widely based on Mix of Customers/P/Ns
Hi Mix Low Volume vs Hi Volume Low Mix
Supplier Value 5%-35% depending on scenarios
Avoid Trap of exact information vs. OK approximation
No one Accounting system have this much resolution
Qualified Information is also valuable
104. 104 Summary Results:
Identify Changes to realize savings
Warehouse consolidations
New Sales Initiatives with same Head Count
Lower Inventory
Improved A/Rs/Cash cycles
105. 105