Download
1 / 38
420 likes | 1.29k Vues
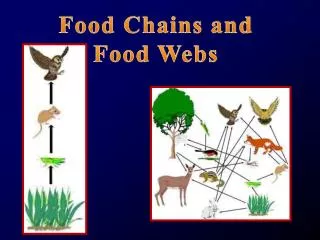
Food Webs and Energy Flow. Chapter 17. 1. What is a food chain? Ex: midwest deciduous forest & Artic & 1 other ecosystem. Gulf of Mexico: Osprey as top carnivore. Ex 2. Midwest. Ex 3. For each example, be able to list 2 – 3 food chains.

E N D
Food Webs and Energy Flow Chapter 17
1. What is a food chain? Ex: midwest deciduous forest & Artic & 1 other ecosystem. • Gulf of Mexico: Osprey as top carnivore
Ex 3. For each example, be able to list 2 – 3 food chains. • Summerhayes and Elton studied feeding relations on Bear Island in High Arctic. • Primary producers were terrestrial plants and aquatic algae. • Fed on by several kinds of terrestrial and aquatic invertebrates. • Consumed by birds. • Attacked by arctic foxes.
2. What is a food web? • Make a food web for grasslands, using symbols provided in handout
3. Describe each of the following trophic levels and give an example of each. • Trophic Level: Position in a food web determined by number of energy transfers from primary producers to current level: • Primary producers occupy first level. Autotrophic, energy from sun or chemicals. • Primary consumers occupy second level. • herbivores • Secondary consumers occupy third level. • Omnivore or carnivore • Tertiary consumers occupy fourth level. • Carnivore
4. What are energy or biomass pyramids? What are they used for? Draw ex.
5. Keystone Species • If keystone species reduce likelihood of competitive exclusion, their activities would increase the number of species that could coexist in communities.
5. Keystone species • A keystone species is a species that has a disproportionate effect on its environment relative to its abundance. • organism plays a role in its ecosystem that is analogous to the role of a keystone in an arch. • While the keystone feels the least pressure of any of the stones in an arch, the arch still collapses without it. • ecosystem may experience a dramatic shift if a keystone species is removed, even though that species was a small part of the ecosystem by measures of biomass or productivity.
5. Keystone example – yellowstone Nat. Park • Before wolves after wolves • High coyote low coyote • High red fox low red fox • Low weasel several weasel sp. • Low rabbit higher rabbit • Low rodent more rodent species • (mice, rat) • High mule deer lower deer • High elk lower elk • Less diverse veg more diverse vegetation • Fewer hawks more hawks
Effects of Predation by Birds on Herbivory • Birds reduce densities of insect larvae feeding on dominant understory shrub. • Higher densities of insect larvae translated directly into higher levels of damage to shrubs. • Marquis and Whelan found higher densities of herbivorous insects on tress from which birds were excluded.
Effects of Predation by Birds on Herbivory • Atlegrim studied influence of birds on herbivorous insects and insect-induced plant damage. • Insectivorous birds may act as keystone species via effects on herbivorous insects. • Larval insect densities peak when many insectivorous birds are feeding their young.
Keystone Species: Summation • Power :Keystone species exert strong effects on their community structure, despite low biomass.
6. Consumers’ Effects on Local Diversity • to resolve the effect herbivores have on plant diversity, you need to know: • Herbivore food preference. • Competitive relationships between plant species in the local community. • Variance in feeding preferences and competitive relationships across environments. (Lubchenko)
6. Consumers’ Effects on Local Diversity • When snails are present in high densities, Littorina grazes down Enteromorpha, releasing Chondrus from competition. • Green crabs (Carcinus maenus) prey on young snails, preventing juveniles from colonizing tide pools. • Populations of Carcinus are controlled by seagulls. • 1) Seagull --- green crabs --- algae species • 2) seagulls--- snails -----algae species
6. Consumers’ Effects on Local Diversity • Low snail density - Enteromorpha dominates tide pool. • Medium snail density - Competitive exclusion eliminated, and algal diversity increased. • High snail density - Feeding requirements are high enough that snails eat preferred algae and less-preferred algae. • Algal diversity decreased.
6. Con’t Example: Consumers’ Effects on Local Diversity • Lubchenko studied influence of intertidal snail (Littorina littorea) on structure of an algal community. • Snails fed on green (Enteromorpha spp.) and red (Chondrus crispus) algae. • Under normal conditions, Enteromorpha out-competes Chondrus in tide pools, and Littornia prefers Enteromorpha. • In the absence of snails, Chondrus is competitively displaced.
7. Exotic Predators • Exotic species have dramatic impacts on communities because they were outside the evolutionary experience of local prey populations. • Nile Perch (Lates nilotica) exotic fish predator in Lake Victoria. • Fish fauna dramatically reduced. Local examples: gobi, zebra mussels
7. Exotic Predators Species diversity decreased after nile perch introduced.
Exotic Predators • Kaufman pointed out changes in Lake Victoria fish community coincide with other ecosystem changes. • Dissolved oxygen concentrations significantly decreased. • Cultural eutrophication.
8. Define terms associated with energy production and energy flow. • Primary production: Fixation of energy by autotrophs in an ecosystem. • Rate of primary production: Amount of energy fixed over a given period of time. • Gross primary production: Total amount of energy fixed by autotrophs. • Net primary production: Amount of energy leftover after autotrophs have met their metabolic needs.
9. What is AET? How do ecosytems compare? • annual actual evapotranspiration (AET). • AET: Annual amount of water that evaporates and transpires off a landscape. • Cold dry ecosystems tend to have low AET. • positive relationship between net primary production and AET. • east-west variation in primary production correlated with rainfall. (east = wetter)
9. Con’t • Draw • Compare ecosystems
10. Why do coral reefs and marine ecosytems have the highest primary productivity? • Highest rates of primary production by marine phytoplankton are generally concentrated in areas with higher levels of nutrient availability. • Highest rates found along continental margins. • Nutrient run-off from land. • Sediment disturbance • Open ocean tends to be nutrient poor. • Vertical mixing main nutrient source.
10. Marine productivity con’t • Highest marine productivity.
10. Con’t grasslands • McNaughton estimated Serengeti grazers consume an average of 66% of annual primary production. • Rate of primary production in the Serengeti is positively correlated with rainfall quantity. • Found grazers can increase primary production. • Increased growth rate. • Lower respiration rate due to lower biomass. • Reduced self-shading. • Improved water balance due to reduced leaf area.
10. Con’t • Primary Production in the Serengeti
11. What is Lindeman’s efficiency concept? • Lindeman concluded the ecosystem concept is fundamental to the study of energy transfer within an ecosystem. • Suggested grouping organisms within an ecosystem into trophic levels. • Each feeds on level immediately below. • As energy is transferred from one trophic level to another, energy is degraded.
12. Calculate Energy flow in an ecosystem • Gosz studied solar energy flow: • 15% reflected • 41% converted to heat • 42% absorbed during evapotranspiration • 2.2% fixed by plants as gross primary production • 1.2% used in plant respiration • 1% left for primary production
12. Energy flow con’t • sun • 30% reflected, 20% absorbed by atmosphere • 50% absorbed by ground, water or vegetation • 1% left for photosynthesis
Producer level • Producer ex 2. • 15,000 stored 10,000 calories • 60% of 15,000 =9000 stored ____________ • 40% waste (6000) ____________
primary consumer • 20% of 9000 = 1800 eaten ____________ • 10% stored = 180 ____________ • 90% lost = 620 ____________
secondary consumer • 30% of 180 = 54 cal ____________ • 10% stored = 5.4 cal ____________
tertiary consumer • 30% of 5.4 = 1.6 cal ____________ • 10% stored = .16 ____________