Download
1 / 71
710 likes | 948 Vues
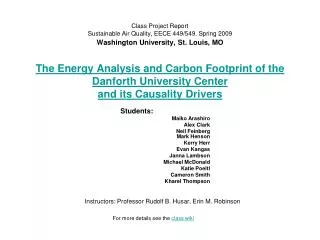
Class Project Report Sustainable Air Quality, EECE 449/549, Spring 2008 Washington University, St. Louis, MO The Carbon Footprint of Danforth Campus and its Causality Drivers. Instructors: Professor Rudolf B. Husar, Erin M. Robinson. Students: Devki Desai Martin Groenewegen Tyler Nading

E N D
Class Project ReportSustainable Air Quality, EECE 449/549, Spring 2008Washington University, St. Louis, MOThe Carbon Footprint of Danforth Campusand its Causality Drivers Instructors: Professor Rudolf B. Husar, Erin M. Robinson Students: Devki Desai Martin Groenewegen Tyler Nading Kate Nelson Matt Sculnick Alyssa Smith Varun Yadav See also a 5 min screencast and more details on the class wiki
Main Components of WU Carbon Emissions: On Campus Energy Use in Buildings and Transportation On Campus Energy Use Carbon Impact The impact on carbon arises from on-campus energy use and from transportation Heating Cooling Appliances Transportation Carbon Impact Commuting Air Travel Students University Fleet Faculty/Staff
Transportation Devki Desai Tyler Nading Varun Yadav
Washington University Transportation Emission • Commuter Travel • Faculty/Staff • Students • University Fleet • Air Travel • Athletic Meets • Study Abroad • Faculty Air Travels
Annual Commuter Emission Calculation 2,421 grams of Carbon/Gallon as given by the Code of Federal Regulations (40 CFR 600.113) 44 gm CO2 miles gallons 0.99 % fuel oxidized X Emissions = 12 gm C year mile # people X X X X • Factors effecting the emission: • # of people commuting to WashU • miles driven per year • gallons of fuel required • amount of Carbon or Carbon Dioxide produced by the fuel
Data Collected Student Parking Permit Data: Only 2007-08. Student Local Address Data Student Home Address Data Faculty/Staff Parking Permit Data: Only 2007-08. Faculty/Staff Local Address Zip code: Only 2007-08.
Issues with Data Some students provide their permanent home address zip code instead of local address zip code Each year over 3000-4000 students do not provide zip code. Historic faculty/staff local zip code not available. Historic parking permit data not available.
2007-08 Data on Google Earth Distance within 150 miles to WashU considered for analysis.
Distance Calculation Zip code converted to latitude and longitude based on U.S. Gazetteer and zipinfo. For WashU, coordinates of Brookings Hall (38.648N, 90.305W) considered. Distance from zip code coordinates to WashU coordinates calculated using the reference formula: Δx = 69.1*(lat1-lat2); Δy = 53.0*(lon1-lon2), Distance (in miles) = (Δx2+Δy2) 1/2. Calculates straight line distance between WashU and centroid of zip code
Fudge factors required for calculated distance Highways and road directions Bridges on East and North St. Louis 18% for Students 40% for Faculty/Staff
Annual Distance Traveled Assume every person makes 1 round trip (2 trips) to school per working day of the year Faculty/Staff - 225 working days per year Students - 165 working days (excluding vacations)
Student Commuters The number of students living within 150 miles of the Danforth Campus have not lead to an increase in the amount of parking permits issued as our data implied.
1991-92 1995-96 Annual miles driven per student decreased most dramatically from 2002-2007. This is explained in part by the shift in student residences from 2001-2007. 2000-2001 2007-08
University Fleet Contribution The University fleet grew and contribution steadily increased despite improvements in fuel economy, yet is minimal in comparison to student commuter carbon emissions.
Air Travel Emissions • General areas of air travel • Faculty • Study abroad • Athletics • Methodology • Faculty air travel not considered • Study abroad data was provided for the past 6 years • Athletic air travel data provided for the past 3 years
On Campus Energy Use Kate Nelson Alyssa Smith
Building Use by Category Instruction and Departmental Research Organized Research Other
Area Growth through Buildings Instruction and Departmental Research: 1% Organized Research: -40% Other: 43% Total: 35%
Monthly Total Electricity Use • Monthly data for Danforth campus electricity use • Data for 1996-2000 is incomplete and not shown above
Seasonal Electricity Use • Electricity use peaks in the summer
Electricity Yearly Increase 60% 40% Baseline electricity use has increased ~60% since 1990 Cooling electricity use has increased ~40% since 1990
Electricity Use Compared to Building Area • Electricity used per unit area for cooling has not increased significantly • Baseline electricity use has increased 15% more than building area • Increase in baseline electricity use per unit area due to increased computer and electronics use
Electricity Use Distribution Electronic devices account for ~25% of 2007 electricity use Lighting and electronics account for a large portion of electricity use and reductions can easily be made in this area Reductions in cooling are more difficult to implement
Monthly Total Fuel Use • Monthly natural gas use on Danforth campus from 1997 to 2007
Seasonal Fuel Use • Fuel use peaks in the winter
Fuel Yearly Increase -10% 65% • Heating fuel use has decreased ~10% since 1997 Baseline fuel use has increased ~65% since 1997
Fuel Use Compared to Building Area • Fuel used per unit area for heating has decreased, ~30% less fuel is used per unit area • Baseline fuel use has increased 25% more than building area
Fuel Use Distribution Residential area built in 2001 Hot water heating requirements can easily be reduced Heating needs are major use of fuel and not easily reduced
Linear Causality Model for Campus Carbon Emissions Carbon/BTU • The carbon impact of on-campus energy is due to direct fuel consumption and indirectly from electricity use • The overall carbon impact for on campus energy consumption has increased 50% from 1990-2007 • Electricity use contributed about 80 percent to the on-campus carbon impact Fuel Cons.BTU/yr C EmissionTon C/yr $/Student Sq. Ft./$ BTU/Sq.Ft. PopulationStudents Activities$ Expend./yr Buildings Sq. Ft Kw-hr/Sq.Ft. Electr. ConsKw-Hr/yr Fuel Cons. BTU/yr C Emission Ton C/yr BTU/Kw-hr Carbon/BTU
The student population increased only by 10% since 1990 • However, the expenditures/student have increased by 60 percent • The buildings/expenditure has barely changed and the increased expenditures were matched by 60% growth in campus building area • Neither the energy use/sq ft nor the C emission/energy use has changed much • Hence, the key driver for the 60% carbon emission growth were the increased expenditures (prosperity) and the associated growth in the physical campus expansion.
WU Comparison with Other Universities Martin Groenewegen Tyler Nading
What is in this analysis: Carbon assessments from other schools Use to make sense of WU's report Different data Purchased electricity Stationery sources (labs, steam generation, etc) Transportation (University fleet, Commuting students, Commuting Faculty and Staff) Ag Wastes Solid Wastes
Colleges and Universities • Carleton College • Harvard • Tufts University • University of New Hampshire • Smith College • Lewis and Clark • Middlebury College • University of Central Florida • Penn State University Park • Tulane University • Utah State University • Oberlin College • Duke University • University of Pennsylvania • Colby College • Wellesley College • Rice University • University of Illinois at Chicago • Penn State • College of Charleston • Yale • University of California, Santa Barbara • California State Polytechnic University • University of Connecticut • University of California, Berkeley • Amherst College • College of William and Mary • UT, Knoxville • Connecticut College • Occidental College • Colorado State University
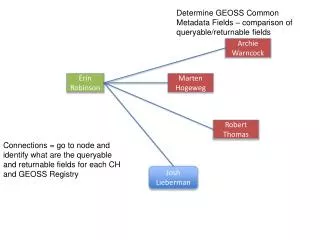
Why analyze the others Determining scope of emission Finding new ways to handle a lack of data/estimations with limited details Method validation Structuring of the Wash U report
Tr-CSt=Transportation Commuting Students PE=purchased electricity Tr-CSF=Transportation Commuting Fac. Staff ST=Stationery sources Tr-A=Transportation Air Re=Refrigerants SW=Solid Wastes Tr-UF=Transportation University Fleet Ag=Agriculture Wastes
Duke Wash U
And the Study Shows: Wash U is average Overall correlation between size and emission Some out liars do exist Improvements • Do this study for a longer period of time using interim reports • Check the units • Comprise more comparisons for the given student body populations
Analysis of Transportation Sector From Other Schools’ Inventories • Purpose • Examine methodology used by other schools to account for transportation emissions • Determine trends/drivers for transportation emissions • Use findings as measuring stick for WU • Methodology observed • Error observed
Linear trend observed • Variance observed and expected • Duke and Penn outliers