Download
1 / 13
130 likes | 524 Vues
Miami Dade. Miami Dade. 55,480. 60,096. Broward. Miami Dade. 49,573. 52,712. Palm Beach. Broward ... CTPP Data provided at same geography as Travel Demand models ...

E N D
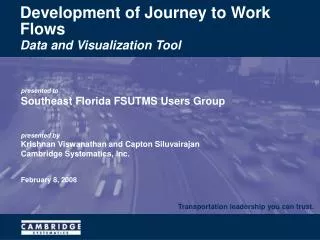
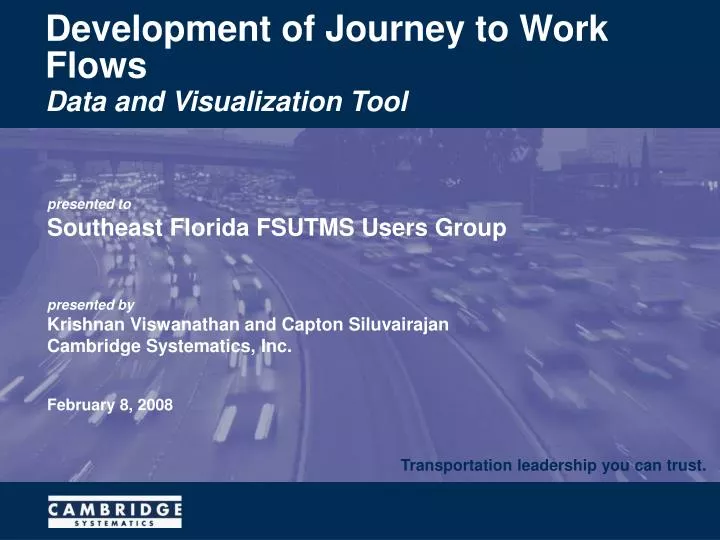
Development of Journey to Work Flows Transportation leadership you can trust. Data and Visualization Tool presented toSoutheast Florida FSUTMS Users Group presented byKrishnan Viswanathan and Capton SiluvairajanCambridge Systematics, Inc. February 8, 2008
Outline • CTPP Description • Project Objective • Data Development • Dynamic Visualization of Journey to Work (JTW) Flows • Summary and Future Work
The Census Transportation Planning Products (CTPP) provides tabulations of households, persons and workers CTPP is a set of special tabulations from the decennial census designed for transportation planners The data are tabulated from answers to the Census 2000 long form questionnaire, mailed to one in six U.S. households CTPP Description
Evaluate existing conditions Develop or update travel demand models Analyze demographic and travel trends CTPP Description
Project Objective Compile TAZ-to-TAZ Journey-to-Work (JTW) tabulation from Census 2000, using the latest regional TAZ structures for Brevard, Indian River, St. Lucie, Martin, Palm Beach, Broward, and Miami-Dade Counties. • CTPP Part 3 flow data good source for validating HBW trip tables • Geographic coverage of Part 3 data • County • Census Tracts • TAZs (State and MPOs)
Data DevelopmentProcess • Merge model areas • Universe is workers who live and work in the region • Area ratio at work end • Weighted population ratio at residence end • Worker flows that are equal to four are converted to five • Ratios less than one percent ignored
Dynamic visualization of flows between residence and workplace TAZs ARCGIS desktop platform Database is flow data developed for model TAZ structure Dynamic Visualization of JTW Flows
Dynamic Visualization of JTW Flows • Four classes of Scenarios • One residence TAZ to One workplace TAZ • One residence TAZ to Many workplace TAZs • Many residence TAZs to Many workplace TAZs • Internal Trips • Can aggregate to County or State level • Export results to text file
Summary and Future Work • CTPP Data provided at same geography as Travel Demand models • Helpful to validate HBW trip tables • Visualization tool provides richer understanding of the flow between residence and workplace areas • Next iteration of tool will include mode shares of JTW flow • Drive Alone • Shared Ride • Transit • Migrate to web based GIS platform
Acknowledgements • Min-Tang Li • Shi-Chiang Li • Nanda Srinivasan