Download
1 / 20
200 likes | 547 Vues
Mapping: Techniques that enable managers to develop differentiation and ... in mid-income levels who shop for apparel, accessories, and home furnishings] ...

E N D
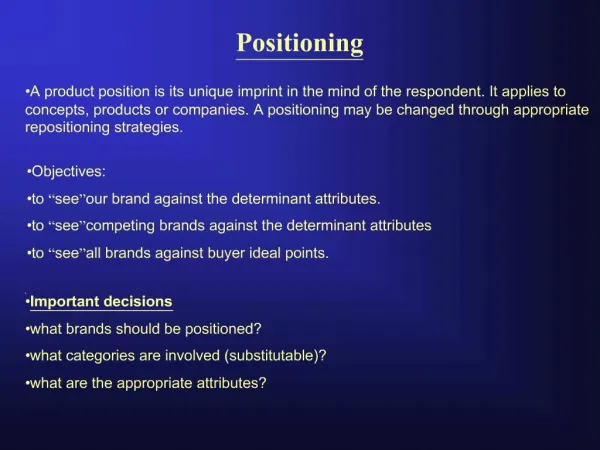
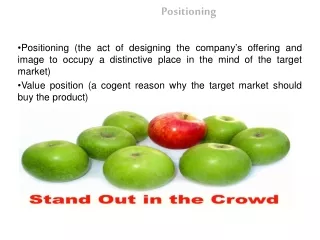
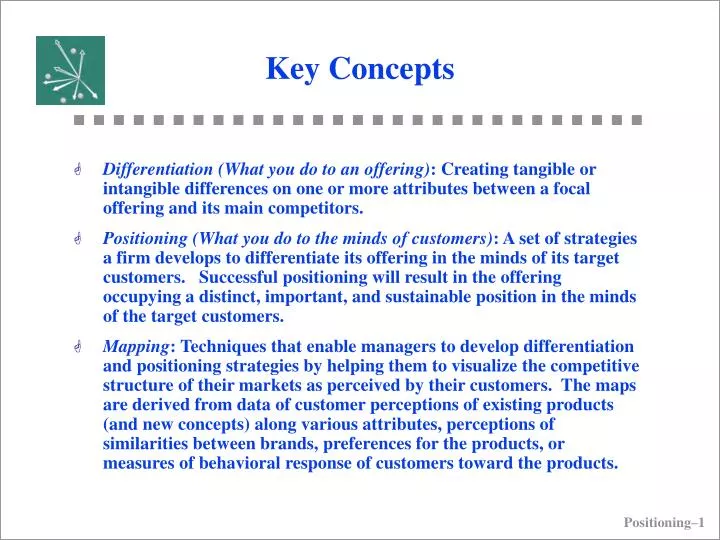
Key Concepts • Differentiation (What you do to an offering): Creating tangible or intangible differences on one or more attributes between a focal offering and its main competitors. • Positioning (What you do to the minds of customers): A set of strategies a firm develops to differentiate its offering in the minds of its target customers. Successful positioning will result in the offering occupying a distinct, important, and sustainable position in the minds of the target customers. • Mapping: Techniques that enable managers to develop differentiation and positioning strategies by helping them to visualize the competitive structure of their markets as perceived by their customers. The maps are derived from data of customer perceptions of existing products (and new concepts) along various attributes, perceptions of similarities between brands, preferences for the products, or measures of behavioral response of customers toward the products.
Crowded Markets Consumers face increasing number of choices • Over 8,200 mutual funds • Over 150 models of cars • Over 30,000 products in a grocery store • Over 100,000 prescription drugs If we can figure out in the crowd, we will have a better handle on our future profitability.
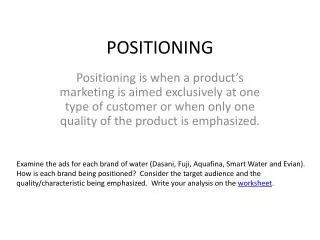
Some Positioning Bases • Life style (self-concept) positioning • Attribute positioning • Benefit positioning • Competitive positioning • Time-based (e.g., usage occasion) positioning
Generic Positioning Strategies • Our product is unique (eg, Perdue chicken). • Our product is different (eg, Listerine). • Our product is similar (eg, Meister Brau).
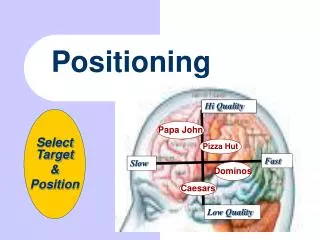
Apple iPod BMW Burger King Charmin Tissue Coke Chevy Trucks Colgate Total Toothpaste Disney GE Mobil Service Stations Universal’s Orlando Visa Volvo Viagra Lipitor Some SuccessfulPositioning Themes 1000 songs Exceptional performance Have it your way Softness Authentic, real, original Tough, strong, durable Total dental protection Wholesome family entertainment Improves the quality of life Fast, friendly service Thrills, excitement, escape Accepted everywhere Safety Quality of life More potent at lower price
Example Positioning Statements For [target segment], the [product/concept] is [most important claim] because [single most important support]. Iomega For [PC Users], the [IOMEGA Zip drive] isthe [best portable storage device]because[it is most cost-effective system]. JC Penney For[Modern Spenders and Starting-outs in mid-income levels who shop for apparel, accessories, and home furnishings]we offer[private-label, supplier exclusive, and national brands]that [deliver greater value than that of our competitors]because of[our unique combination of quality, selection, fashion, service, price, and shopping experience]. (From jcpenney.com)
Example Positioning Statements Pantene • For [females 18-49 who possess dry damaged hair and believe they cannot achieve truly healthy/shiny hair] Pantene is a [hair care system (shampoo/conditioner/ styling aids)] that offers[“hair so healthy it shines”] because it [“penetrates from root to tip” through its patented Pro-Vitamin B5 formula]. Microsoft .NET • For [companies whose employees and partners need timely information], Microsoft.NET is a [new protocol and software system]that enables[unprecedented levels of software integration through XML Web services], because [unlike Java, .NET is infused into the Microsoft platform, providing the ability to quickly and reliably build, host, deploy, and utilize connected applications].
Marketing Opportunities Associated with Positioning • Find unmet (or inadequately met) customer needs and wants. • Identify product strengths that are unique and important. • Determine how best to overcome product weaknesses. • Identify market segments for which a particular product or new concept would be appealing.
Positioning is not ... • just clever slogans or gloss • what we push on our customers -- it is what customers will realistically grant us • a one-time activity • an appeal to everyone • a way to make our product superior -- it is about finding a superior position in the minds of customers.
Initiating Positioning Studies in Companies Four questions that could trigger positioning analyses • Who do we need to target? • What do they think now? • What do we want them to think, now and from now on? • How do we do that?
Why Mapping? An organic chemist reads diagrams such as the one here An Electrical Engineer reads diagrams such as the one here Positioning 11
An Example of Positioning (Exhibit 3-13) High moisturizing 7 Tone Zest 4 Lever 2000 Dove 2 5 Safeguard Coast Lux 8 Nondeodorant Deodorant 3 1 Dial Lifebuoy Lava 6 low moisturizing
Can You See Patterns in These Customer Data? Ratings of nine brands of notebook computers on several attributes B1 B2 B3 B3 B4 B5 B6 B7 B8 New Attractive 5.1 3.6 3.5 5.4 3.9 4.8 5.2 4.0 5.2 4.0Light 6.0 3.5 5.0 3.9 3.3 5.3 5.0 2.5 5.5 2.5Unreliable 3.4 4.1 4.5 2.1 4.5 2.7 4.5 3.7 2.5 3.8Plain 1.5 4.1 2.9 2.3 4.5 2.7 3.5 4.3 2.2 5.2Battery life 3.3 4.9 4.3 4.1 3.9 3.0 3.5 6.2 3.5 4.0Screen 3.5 5.3 3.4 6.4 5.4 5.2 3.3 6.0 3.3 4.8Keyboard 2.6 3.5 2.5 3.4 3.8 3.3 2.8 5.0 4.3 4.7Roomy 5.5 4.3 5.4 3.1 3.4 3.3 4.7 3.5 4.3 4.2Easy service 4.5 4.9 3.3 5.0 4.4 4.5 3.3 4.7 3.8 4.5Expandability 5.5 4.3 5.4 3.1 3.4 3.3 4.7 3.5 4.3 4.2Setup 5.6 3.5 5.6 5.4 2.5 4.2 5.2 3.3 5.8 2.5Common 4.1 3.5 3.3 2.9 4.0 4.3 2.2 4.2 3.3 4.2Value 3.5 4.8 4.4 3.6 3.6 2.7 3.2 4.7 3.5 4.0Preference 7.4 3.4 4.8 6.6 4.4 7.4 7.1 3.8 6.9 3.3
Conventional Mapping UsingSnake Charts Does notDescribes it describecompletely it at all | | | | | | 0 1 2 3 4 5 1. Company provides adequate insurance coverage for my car. 2. Company will not cancel policy because of age, accident experience, or health problems. 3. Friendly and considerate. 4. Settles claims fairly. 5. Inefficient, hard to deal with. 6. Provides good advice about types and amounts of coverage to buy. 7. Too big to care about individual customers. 8. Explains things clearly. 9. Premium rates are lower than most companies. 10. Has personnel available for questions all over the country. 11. Will raise premiums because of age. 12. Takes a long time to settle a claim. 13. Very professional/modern. 14. Specialists in serving my local area. 15. Quick, reliable service, easily accessible. 16. A “good citizen” in community. 17. Has complete line of insurance products available. 18. Is widely known “name company”. 19. Is very aggressive, rapidly growing company. 20. Provides advice on how to avoid accidents.
Perceptual Maps Using Attribute Ratings Example: Positioning of Beers • Select a set of Beers e of interest to the target group of customers. • Identify a set of key attributes on which these Beers evaluated by the target group (e.g., through focus groups). • Ensure that customers are familiar with the products of interest. • Have customers evaluate the products on the chosen set of attributes (e.g., Light-Heavy; Cheap-Expensive; Drink alone-Share with friends). • If desired, include “Preference for the Beers” as one of the attributes.
Perceptual Map of Beer Market (This slide shows only the products) Old Milwaukee Budweiser Beck’s Meister Brau Heineken Miller Coors Stroh’s Michelob Coors Light Miller Lite OldMilwaukee Light
Perceptual Map of Beer Market (This slide shows only the attributes) Heavy Popular with Men Heavy Full Bodied Special Occasions Blue Collar Dining Out Premium Good Value Budget Premium Popular with Women Pale Color On a Budget Light Less Filling Light
Perceptual Map of Beer Market (This slide includes both products and attributes) Heavy Popular with Men Heavy Full Bodied Old Milwaukee Budweiser Beck’s Meister Brau Heineken Special Occasions Miller Blue Collar Dining Out Premium Good Value Coors Stroh’s Budget Premium Michelob Popular with Women Coors Light Miller Lite Pale Color On a Budget OldMilwaukee Light Light Less Filling Light Interesting web site to visit: www.ratebeer.com
Two Preference Models Ideal-Point Preference Model Vector Preference Model IncreasingPreference Preference Preference DecreasingPreference Ideal Point Attribute Attribute (eg, sweetness) (eg, service speed)