Download
1 / 50
500 likes | 815 Vues
Industrial change and globalisation: Challenges for the European Social Model. Economic growth scoreboard. Afghanistan 29.0% Turkmenistan 23.1% Equatorial Guinea 20.0% Chad 15.0% Isle of Man 13.5% Azerbaijan 11.2% Liechtenstein 11.0% Faeroe Islands 10.0% Armenia 9.9%

E N D
Industrial change and globalisation: Challenges for the European Social Model
Economic growth scoreboard Afghanistan 29.0% Turkmenistan 23.1% Equatorial Guinea 20.0% Chad 15.0% Isle of Man 13.5% Azerbaijan 11.2% Liechtenstein 11.0% Faeroe Islands 10.0% Armenia 9.9% Ukraine 9.4% Kazakhstan 9.2% China 9.1% Lithuania 9.0% Argentina 8.7% Qatar 8.5% India 8.3% Bhutan 7.7% San Marino 7.5% Algeria 7.4% Latvia 7.4% Russia 7.3% Botswana 7.2% Vietnam 7.2% Cook Islands 7.1% Nigeria 7.1% Albania 7.0% Tajikistan 7.0% Mozambique 7.0% CIA: World Fact Book 2003-04
Balance of payments scoreboard (Billion USD) Hong Kong 17,4 France 13,8 Malaysia 13,4 United Arab Emirates 12,5 South Korea 12,3 Netherlands 12,1 Belgium 10,7 Finland 10,3 Venezuela 9,7 ……. United Kingdom -7,6 USA -541,8 Japan 135,9 Germany 57,2 Switzerland 36,0 Russia 35,9 China 31,2 Norway 29,3 Taiwan 28,6 Singapore 26,2 Saudi Arabia 22,2 Sweden 19,6 Canada 18,6
% US FDI - % of total – (2004: 1st + 2nd Q) % US Direct investment abroad. US Dep. of Commerce.
UK Foreign Direct Investment - % of total % Direct investment abroad. UK National Statistics
EU - US GDP Growth Unemployment Government budget Balance of Payments
US current account 1889 – 2004 - % of GDP Source: OECD Economic Outlook no. 76
World Economic Forum scoreboard 2004 • GLOBAL: • Finland • USA • Sweden • Taiwan • Denmark • Norway • Singapore • Switzerland • Japan • Iceland • UK • Netherlands • Germany • Australia • Canada • EU: • Finland • Sweden • Denmark • UK • Netherlands • Germany • Austria • Estonia • Spain • Portugal • Belgium • Luxembourg • France • Ireland • Malta 16. Slovenia 17. Lithuania 18. Greece 19. Cyprus 20. Hungary 21. Czech Republic 22. Slovakia 23. Latvia 24. Italy 25. Poland Based on broad concept. Results very similar to Lisbon benchmarking
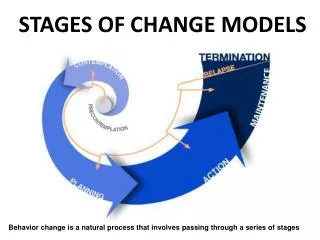
Economic policies The introduction of the Euro put focus on Structural Policies Lisbon was an answer Did politicians listen? Monetary Policy Fiscal Policy Structural Policies
The Lisbon process – the target Adopted by Heads of State and Government in Lisbon Spring 2000: To make Europe the most competitive, knowledge-based economy in the world by 2010, based on social cohesion and environmental sustainability Progress to be measured by the Open Method of Coordination: Benchmarking and adoption of best practices Sustainability issues added one year later in Gothenburg
The Lisbon process Primarily inspired by the growth, jobs and productivity gap to US A ten-year plan to restore European Competitiveness ‘Soft’ rather than ‘hard’ law (different from Internal Market) Open method of Coordination
There is a European Economic and Social Model and it is characterised by large public sector, focus on welfare state and emphasis on the environment. Taxes as % of GDP: Japan: 26% USA: 25% China: 16% EU-15: 40% India: 17%
European Economic and Social sub models Northern Anglo-Saxon Eastern? Continental Southern
European Economic and Social sub models Similarities: Hands-off approach to markets Differences: Size of welfare state Northern Anglo-Saxon Similarities: Large welfare sector Differences: Approach to market OECD: Countries with relatively liberal attitude to product market regulation: UK, Ireland, Denmark, Slovakia, Sweden, Finland, Netherlands. Countries with relatively restrictive attitudes: Germany, Spain, France, Czech Rep., Italy, Hungary OECD: Product Market Regulation 1998-2003. February 2005 Continental
European Economic and Social sub models Similarities: Hands-off approach to markets Differences: Size of welfare state Northern Anglo-Saxon Similarities: Large welfare sector Differences: Approach to market Nordic model combines a liberal approach to markets with high quality welfare sector and provides ‘flexicurity’ Continental
Re-introduction of Structural Policies Global competition requires flexibility and a higher knowledge base European population requires confidence and security Target: Combining flexibility and security = Flexicurity
Does a big state prevent competitiveness? Apparently not. This issue is not quantity but quality.
Public sector and competitiveness WEF score 6 Fin Swe Den UK 5 Spa Ger Bel Fra Ita 4 Tax of GDP 30% 40% 50%
Public sector and competitiveness • Public sector reforms are essential for competitiveness agenda: • Value for money • Combat corruption • Modernisation (eGovernment) • Good infrastructures • From passive to active
Globalisation is working €30 €85 Consumers get richer, but can we adapt and create new, sustainable jobs?
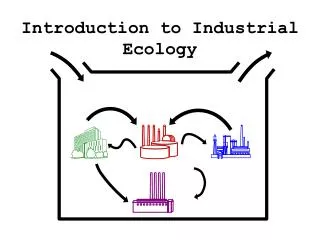
From the industrial society to today IT Logistics - distribution Production Design R&D
Outsourcing – and insourcing In some countries the debate focusess only on outsourcing In others a more balanced debate on outsourcing and insourcing Globalisation is not just about loosing, also winning The negative debate shows fear for lack of competitvness and thus lack of strucutral reform
Attitudes towards globalisation in Europe Source: IMD survey 2004. Index 0-10.
Need for reform Reforms are at least needed in : labour market and social welfare Innovation, entrepreneurship and market
Labour market and social welfare Life cycles are shorter and shorter Need for constant knowledge upgrade Calls for flexible labour market with security and Active Labour Market Policy Ageing population requires life-long learning and longer working life
Innovation entrepreneurship and the markets Europe must be better to grow SME’s Innovation must be brought to the markets – closer links between research and real life Europe’s risk culture underdeveloped
EU budget EU budget can in general contribute in a limited way to development of European competitiveness. Budget is only 1% of GDP – and ½ is for CAP Coordination of national policies would be stronger Focus and link to overall targets could help, but the debate is now on marginal issues on overall size and fight for national corners
GDP per Capita – 2005 Index. EU-15 = 100. PPS US: 158,8 Japan: 118,9
GDP growth rate – 2005Percentage change over previous year US: 3,0 Japan: 2,1
% Total unemployment rate -2004 (%) USA: 5,5
% Labour productivity per person employed 2005 GDP in PPS per person employed relative to EU-25 = 100
Gross domestic expenditure on R&D % of GDP - 2003 % US: 1.91 – Canada: 2.67 – Japan: 3.12
Spending on Human Resources Spending on education as % of GDP % US: 5,35 – Japan: 3.60
Life-long learning % of population 25-64 participating in education and training %
% Internet penetration in EU households - 2004
% Broadband penetration rate – 2004 Number of broadband lines in % of population
% E-government on-line availability 2003
Patent applications to European Patent Office Per 1 million inhabitants - 2002
ICT Expenditure 2004 As % of GDP US: 5,5 – Japan: 3,5
Energy intensity of the economy Consumption of energy divided by GDP. Kg of oil equivalent per 1000 Euro. 2002
Level of corruption US: 7.5 – Canada: 8.5 Transparency International 2003
Flexibility of business environment Composite index. Danish Industry
Labour market regulation IMD survey-2004
Flexibility and agility IMD survey, 2004
Open method of coordination Are models transferable: No, but solutions are to a large extent Why did France have to go through the No vote to discover the Nordic Model? OMC may now work, but not because of EU or Lisbon, but because of desperate search for models that work!