Download
1 / 44
480 likes | 1.01k Vues
MACROECONOMICS. UNIT OF ANALYSIS - ECONOMY AS A WHOLE VARIABLES OF INTEREST - OUTPUT - PRODUCTIVITY - INFLATION - UNEMPLOYMENT METHOD OF ANALYSIS - ECONOMIC MODELING. ECONOMIC MODELING. HYPOTHESIS Relationship of interest Level of sales and the price THEORETICAL FORMULATION

E N D
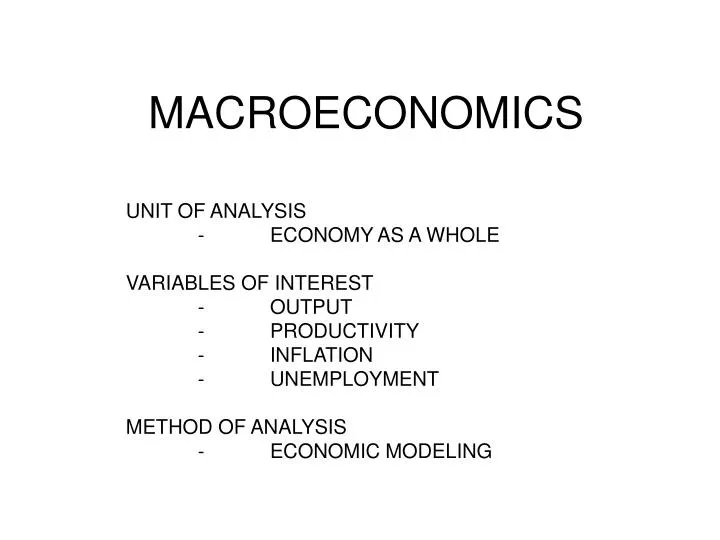
MACROECONOMICS UNIT OF ANALYSIS - ECONOMY AS A WHOLE VARIABLES OF INTEREST - OUTPUT - PRODUCTIVITY - INFLATION - UNEMPLOYMENT METHOD OF ANALYSIS - ECONOMIC MODELING
ECONOMIC MODELING • HYPOTHESIS • Relationship of interest • Level of sales and the price • THEORETICAL FORMULATION • Mathematical relationship • Quantity sold = f (price) = constant – coefficient*Price • EMPIRICAL ANALYSIS – ESTIMATION • EXPERIMENTAL ANALYSIS • THEORETICAL FORMULATION ONLY
ATTENDANCE IN CLASS AS MODEL • Hypothesis • Penalty for missing a class leads to increased attendance • Theoretical formulation • Attendance (A) is a function of many factors • Attendance penalty (X) • Alternative uses of time, and other costs of being in class (difficult to measure and identify, as they differ from student to student) • Quality of lectures (Q) • % of the students in the class majoring in Economics (E) • A=f(X,Q,E)=constant+a*X+b*Q+c*E • A – an endogenous to the model variable • X,Q,E – exogenous to the model variables • Next stage is either empirical or experimental
Example II – Modeling Demand(another microeconomic model) • Quantity = f (Price, other relevant factors) • Consider demand for gasoline at a gas station, other relevant factors will include • Population density/car ownership rate • Fuel efficiency of an average car in the area • State of public transit in the area • Proximity of another gas station • Price charged by a competing gas station • ….and many many more….
Modeling Demand • Assume that we can only observe the price charged by the competitor: Pc (Note: assumptions simplify the reality, but reduce applicability) • Hypothesis • Quantity sold = constant – a*Price + b*Pc • Quantity sold is determined by the model (endogenous) • Price, Pc are inserted into the model (exogenously given) • a, b represent the effects of Price and Pc on Quantity sold; these are the research objectives • Signs on a and b are also part of the hypothesis. a is assumed to be negative because of the law of demand, while b is positive due to the substitution, but this is not always known in advance.
model • Simplification of reality and limitations of the model • Analysis of relationships • Dynamically changing society and the need for evolution of economic thought • From Adam Smith to Karl Marx to John Keynes
Measuring Economic Activity • OUTPUT • EMPLOYMENT • INFLATION
MEASURING OUTPUT • Gross Domestic Product the total market value of all final goods and services produced by factors of production located within a nation’s borders over a period of time (usually one year) • Gross National Product the total market value of all final goods and services produced by factors of production owned by a nation over a period of time (usually one year)
Output • Measuring production • Time period (flow vs. stock) • Final goods and services (value added) • Market prices • Defining an economy (geographical boundaries versus resource ownership) • Gross Domestic Product • Gross National Product • www.bea.govTable 1.7.5 http://www.bea.gov/bea/dn/nipaweb/TableView.asp?SelectedTable=43&FirstYear=2003&LastYear=2005&Freq=Qtr
Consumption Investment Government Spending Imports Exports Main Categories of Expenditures National Income Accounts statistics are available online on the website of The US Bureau of Economic Analysis: www.bea.gov
OUTPUT = INCOME • GNP = GDP + NET PAYMENTS FROM ABROAD (Table 1.7.5) • NNP = GNP – DEPRECIATION • NI = NNP – INDIRECT BUSINESS TAXES • NI represents total payments to nation’s factors of production (profits, rents, wages…). (Table 2.1. Personal Income and Its Disposition)
Real versus Nominal Nominal GDP growth rate = output growth rate + price level growth rate
Measuring Inflation • CPI, PPI, Core Index, GDP Deflator • Data available on BLS website (www.bls.gov) • Construction of an index “indexed average price” • Characteristics of recent US inflation • Low level • Non-uniform • International effect on the US inflation
employment • Labor force and labor force participation • Measuring unemployment • Current Population Survey • Measuring current employment • Survey of businesses Employment data: Bureau of Labor Statistics (www.bls.gov)
Statistics for the US economy For March-July 2003 (seasonally adjusted). Source: BLS Discouraged Worker Phenomenon
Real Output and Unemployment • Okun’s Law • Unemployment increase reduction in Real GDP growth • Estimates suggest that a 1% increase in unemployment rate leads to a 2% decline in Real GDP growth rate: Change in Real GDP growth rate = constant – 2 * change in Unemployment rate • 2001-2003: Jobless Recovery? • 2001-2003: unemployment and real GDP increase at the same time
Classical Economic Theory • Historical roots of the theory • From Adam Smith’s Invisible Hand to XX century economics • Flexibility of all prices • Price adjustment rather than output adjustment • Economy at the capacity equilibrium • The long-run nature of the model
The economy as a self-perpetual system • Spending creates income; income creates means for spending…. The circular flow concept • An important classical assumption: no leakages from the flow: for example, savings immediately translate into investment • Keynes’ Trust Paradox
closed economy: Y = C + I + G Output markets Revenues C I Financial market Private S G households firms Taxes Pub.S Government income Wages, profits, rents = Y Input markets
Demand for Output • Income identity from the Circular Flow Model: Y = C + I + G • Disposable income (after-tax/transfer PI) = Y – T • (Y-T) = C + S • Consumption function (autonomous, induced) • Consumption is induced by disposable income: C = C(Y-T) • Some consumption may be autonomous to disposable income, and be influenced by other factors (expected future Y, interest rate..) C = a + c (Y-T) • Consumption and Saving are the only allocations of disposable income • MPC, MPS • G, T are policy driven and hence not induced by current income.
Demand for output • Investment • Function of real interest rate I(r) • Investment is a decreasing function of the real interest rate (investment is spending by firms on final goods such as capital goods) • The economic measure of the user cost of capital • Interest rate • Economic depreciation
Equilibrium in the output market • Production of output (supply) depends on two factors: • Composition of inputs • Physical capital (K) • Labor (L) • State of production technology • Y = F ( K, L ) • Equilibrium in the classical model (long-run, or capacity equilibrium) If the inputs and the state of production technology are fixed, the supply of goods in the economy is limited by its fixed capacity (recall fixed LRAS from 2105) Note that r, the real interest rate, is not yet determined by the model. Interest rate is simply the price of loanable funds, and the Classical model assumes full flexibility of prices, however there is only one interest rate at which the output market will be in an equilibrium – that equilibrium interest rate must be determined in another market.
Determining the equilibrium interest rate: the financial market • Real interest rate is the real cost of borrowing (investment). Recall that even if investment is cash financed, interest rate is still the cost of borrowing. • GDP identity: Y = C + I + G I = Y – C – G = S (national savings) • National savings: output – expenditures: Y – C – G • Public savings: T – G • Public savings do not depend on the interest rate • Private savings: (Y-T)-C • If we treat C as NOT a function of the interest rate, then private savings are not affected by the interest rate (Mankiw Textbook) • If we assume that autonomous consumption is a function of the interest rate, and is a decreasing function of the interest rate, then the private savings will be an increasing function of the interest rate
Financial market equilibrium r S S, when a(r) I(r) Loanable funds I = (T-G) + [(Y-T) – a – c (Y-T)] = public savings + private savings
Weakness of fiscal expansion in the classical world • Equilibrium in the output market • Equilibrium in the loanable funds market I = (T-G) + [(Y-T) – a – c (Y-T)] • Any increase in G will be offset by equal drop in I (or I+a, if a(r)) – indirect crowding-out • Any decrease in T will be offset by a drop in I = cT (or I+a, if a(r)) – indirect crowding-out
Indirect Crowding-out effect in Fiscal Expansion • Expansionary fiscal policy: T-G • Public Savings decrease r S • Investment declines, offsetting Increase in G. I(r) Loanable funds
The microeconomics • Determination of factor prices • Marginal productivity • The benefit of hiring an additional worker is the change in the total revenues that results from hiring that worker • Value of the marginal product of labor = wage • Similarly, VMPK=R - cost of capital • Constant returns to scale and zero economic profits • Changes in input ratio and changes in input costs
example • Assume the following: • C=100+0.8*(Y-T) • I=1000-100*r • Y=f(L,K)=L^(0.5)*K^(0.5) • L=10000; K=400 • G=T=0 -------------------------------------- • What is the equilibrium level of output? • What is the level of national, public, and private savings? • What is the equilibrium interest rate? -------------------------------------- • Set G=T=200 (balanced budget) -------------------------------------- • Set =200, T=100 (budget deficit) -------------------------------------- • Set G=200, but increase I to I=1100-100r -------------------------------------- • Set G=T=0, original I function, but C=100-10r+0.8*(Y)
money • Functions • Medium of exchange – definition of money • Unit of account • Store of value • Historical forms of money • Commodity money • Gold standard: 1880’s-1914; revised standard in post WWII era • Fiat money
Supply of Fiat Money • Central Bank and money supply • Open market operations • Expansion • Contraction • Recent history of US OMO • http://www.federalreserve.gov/fomc/fundsrate.htm • For more expanded discussion of money supply read appendix at the end of Chapter 18 (p. 482)
Money Market • Real Supply: M/P=f( monetary policy ) • Real Money Demand: Md/P • Transaction demand for money • Function of Y • Opportunity cost of holding M2 assets • Nominal interest rate • Md/P = L( i, Y ) = k Y – a i M/P - supply i Md/P M-balances
Quantity Theory of Money • Transaction need for money • Price*Number of Transactions • Money Supply (Quantity of Money): M • Transaction Velocity of Money: V • Quantity equation (transaction): M*V=P*T --------------------------------------------------------- • Income Velocity of Money • Quantity equation (income): M*V=GDP Deflator * Real GDP
demand for money and quantity theory of money • Money demand: Md • Transaction based: function of nominal GDP (PY): Md=PkY • PY=Md(1/k) V (income velocity) = (1/k) • Real Money Demand: Md/P=kY • Real money balances • In equilibrium real money demand (Md/P) must equal real money supply (M/P) • M/P = k Y M(V=1/k)=PY
inflation • Quantity of money equation: MV = PY • Assumption of constant velocity of money • Inflation • Money supply growth • Russia in the 90’s, Germany in the 20’s • Drop in productive capacity (output) • Monetary Rule • Money supply growth = real GDP growth
Money neutrality • Classical economic theory: • Changes in money supply have no impact on real economic variables: output, real wages, relative prices…
Inflation and nominal rates • Fisher Equation: • Nominal rate = real rate + inflation • For past arraignments: observed inflation • ex post real interest rate • For forward looking: expected inflation • ex ante real interest rate determination • Real Money Demand: • Md/P = L ( i , Y ) = L ( r + exp infl , Y ) • Expectation of future inflation can affect current money demand
SeigniorageorInflationary Tax • Printing money as source of government revenue • Main source of hyper inflation • Dollarization
Costs of inflation • Expected (and unexpected) inflation • Menu Costs • Shoe-Leather Costs • Instability in relative prices • Unexpected inflation • Redistribution of wealth • Uncertainty of future inflation and forward looking arraignments
Open Economy • Presence of foreign sector • Trade • Investment
Trade • X – exports • m – imports • Net Exports: NX = X – m • Y = C + I + G + NX • At any given time period a country’s spending need not equal its output • NX<0 a country spends more than it produces, i.e. borrowing • NX>0 a country’s production exceeds its spending, i.e. lending
National Savings in Open Economy • NS = Y – C – G = I + NX • NX = NS – I • Trade balance = net capital flow • US BoP (www.bea.gov) • Current Account – Trade • Financial Account – Investment
Small Open Economy • Incapable of causing changes in the world’s financial markets, i.e. is a price taker in financial markets, unable to influence the price of loanable internationally funds – interest rate.