Download
1 / 23
230 likes | 733 Vues
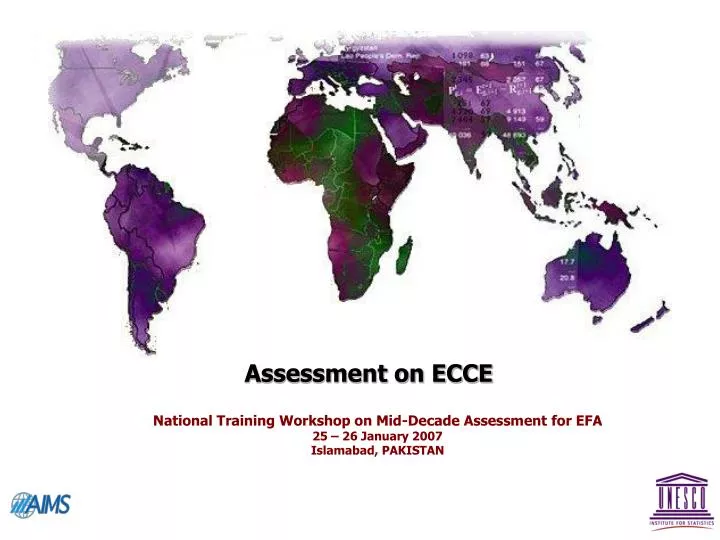
Assessment on ECCE. National Training Workshop on Mid-Decade Assessment for EFA 25 – 26 January 2007 Islamabad, PAKISTAN. Proposed core EFA MDA Indicators for ECCE. Gross Enrolment Ratio (GER) in Early Childhood Care and Education Programmes;

E N D
Assessment on ECCE National Training Workshop on Mid-Decade Assessment for EFA 25 – 26 January 2007 Islamabad, PAKISTAN
Proposed core EFA MDA Indicators for ECCE • Gross Enrolment Ratio (GER) in Early Childhood Care and Education Programmes; • Percentage of New Entrants (NE) to Primary Grade 1 who have Attended Some Form of Organized ECCE Programme; • Private Centre Enrolment as Percentage of Total Enrolment in ECCE; • Percentage of Under-Fives Suffering from Stunting; • Per cent of Household Consuming Iodized Salt; • Percentage of Trained Teachers in ECCE Programmes; • Public Expenditure on ECCE Programs as a Percentage of Total Expenditure on Education
Proposed core EFA MDA Indicators for Gender • Gender Parity Index for GER in ECCE • Gender Parity Index for GIR in Primary Education • Gender Parity Index for NIR in Primary Education Proposed core EFA MDA Indicators for Quality • Percentage of School Teachers who are certified to teach according to National Standard for ECCE
Additional proposed EFA MDA Indicators for ECCE • Net Enrolment Rate in ECCE Programs, including Pre-primary Education • Pupil-Teacher Ratio (child-caregiver/ child ratio) • Public current expenditure on ECCE per child as percentage of GNP per capita • Under-five mortality • Proportion of infants with low birth weight • Vitamin A supplementation coverage rate • Proportion of 1-year old children immunized against DPT3, Polio, Measles, Hepatitis, and other vaccine
Additional proposed EFA MDA Indicators for ECCE • Proportion of population using improved drinking water sources • Proportion of population using adequate sanitation facilities • Proportion of young children whose parents participate in ECCE education program • Proportion of children 0-6 months exclusively breastfeeding • Proportion of under 5 children with anemia • Birth registration rate • Support for early learning • Ratio of girls to boys in enrolment in ECCE
Example illustrations from GMR Population
Example illustrations from GMR Salaries
Example illustrations from GMR Teaching hours
Example illustrations from GMR % of trained teachers
Example illustrations from GMR Net attendance rates
Example illustrations from GMR Net attendance rates by possession of a birth certificates
Example illustrations from GMR Net attendance rates by gender and geographical disparities
Example illustrations from GMR Gender disparities
Example illustrations from GMR Net attendance rates by household wealth
Example illustrations from GMR Age-specific enrolement ratios
Example illustrations from GMR Spending on pre-primary
Example illustrations from GMR Aid to pre-primary
Example illustrations from GMR Selected health and nutrition Indicators for Children
Simple guide to the analysis • Identify the issue (what you want to say) • Find out an appropriate data, indicators • Check the data • Accuracy • Source • Choose an appropriate presentation • Table • Chart/Graph • Map • Decide what you want to find out from the data (pattern, gap, trend) • One to five conclusions per presentation • Informative • Succinct • Clear