Download
1 / 25
260 likes | 780 Vues
Rising Food Prices: Causes, Effects, and Actions Needed. Rajul Pandya-Lorch International Food Policy Research Institute. 2008 Norman E. Borlaug International Symposium “Confronting Crisis: Agriculture and Global Development in the Next 50 Years” Des Moines, October 15-17, 2008. Overview.

E N D
Rising Food Prices:Causes, Effects, and Actions Needed Rajul Pandya-Lorch International Food Policy Research Institute 2008 Norman E. Borlaug International Symposium “Confronting Crisis: Agriculture and Global Development in the Next 50 Years” Des Moines, October 15-17, 2008
Overview • Price developments and causes • Impacts on the poor and hungry • Priorities for action
Most sustained and significant increase of food prices in 3 decades Annual FAO Food Price Index 1998-2000=100, 1961-2008 Source: FAO 2008.
Higher and more volatile prices (As of Sept. 2008) Since Jan. 2003, maize and wheat prices doubled, rice prices tripled, oil prices quadrupled Source: Data from FAO 2008 and IMF 2008.
Soaring global fertilizer prices World Fertilizer Prices, 2000-2008, US$/mt 1400 1200 April 2008 1000 DAP, US Gulf 800 600 400 200 MOP, Vancouver Urea, Arab Gulf, prilled 0 Jan-05 Jan-00 Jan-01 Jan-02 Jan-03 Jan-04 Jan-06 Jan-07 Jan-08 Source: IFDC 2008.
Sources of the price increase • Income and population growth • Energy and biofuels • Slow agricultural response • Market and trade policy
(1) Income and population growth • Income growth (2005-07 per annum) • 9% in Asia, 6% in Africa • 2% in industrialized countries • Population growth of more than 1% per year • Since 2000, global cereal use for: • Food 5%, feed 8%, industry 38% • Non-cereal demand rises dramatically • 6 kg grain generates 1 kg beef • 3 kg grain generates 1 kg pork • 2 kg grain generates 1 kg poultry Sources: FAO 2003 and 2008; IMF 2008.
(2) Energy and biofuels Energy prices traditionally affected agric. input prices (fertilizer, pesticides, irrigation, transport) Now, they also affect agric. output prices through opportunity costs Generous developed country subsidies for biofuels and energy crops distort markets Biofuel demand contributed to 30% of the increase of grain prices in 2000-07 Source: Rosegrant 2008
(3) Slow agricultural response: Declining productivity growth Source: World Development Report 2008.
(4) Market and trade policy:Distorting ad hoc measures • Export bans/restrictions: • Reduce global market size, increase volatility, harm import-dependent trading partners • Stimulate cartel formation, undermine trust, encourage protectionism E.g. Argentina, China, India, Indonesia, Russia • Price controls: • Reduce farmers’ incentives to produce more • Divert resources away from those who need them most E.g. China, Egypt, Malaysia, Pakistan, Russia
Variety of government policy responses Source: IMF, FAO, and news reports, 2007-08.
Overview • Price developments and causes • Impacts on the poor and hungry • Priorities for action
Poor ($.75 cents – $1) 485 million people Medial poor ($.50 cents – $.75 cents) 323 million people Ultra poor (less than $.50 cents) 162 million people Looking beneath the $1 a day line (2004) Source: Ahmed et al. 2007.
World map of hunger:2008 GHI by severity Source: von Grebmer et al. 2008.
The number of hungry increased in 2007, mainly due to high food prices The number of undernourished in 2007 increased by 75 mil. since 2003-05 (to 923 mil.) • Asia / Pacific 41 mil. • Latin America / Caribbean 6 mil. • Near East / North Africa 4 mil. • Sub-Saharan Africa 24 mil. Sources: FAO 2008.
Impact of High Prices • At country level • Net food exporters gain • Net food importers struggle • Impact within a country depends on price transmission • At household level • Net sells benefit • Net food buyers harmed – the majority of the poor
Impacts of high prices on the poorest Driven by initial conditionsand adjustments in labor, finance, and goods markets Level of inequality below the poverty line (up) Exclusion and discrimination (up) Level of diet (low) and nutritional deficiencies (high) Wage rate adjustments among unskilled labor to changing prices (slow) Capability to respond to market opportunities (small) A 50% increase in food prices in Bangladesh = 25% more prevalence of micronutrient deficiency in women and children (Bouis 2008)
Irreversible consequences with long-term impact • Deterioration of nutritional status of women and preschool children • Withdrawal of children esp. girls from school • Distress sale of productive assets and decrease of purchasing power
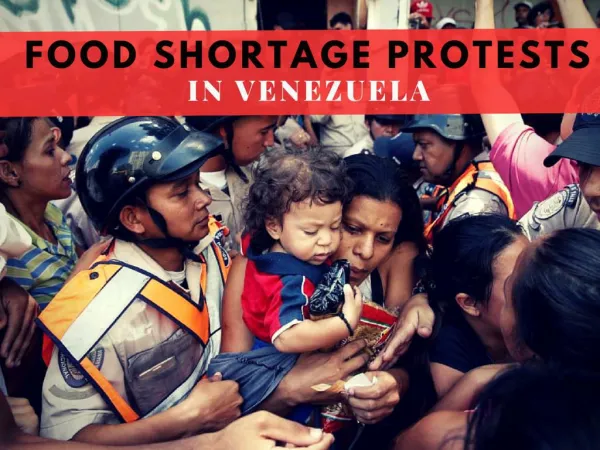
The food crisis tradeoffs and effects + Mass protests in about 60 countries Violent: Bangladesh, Egypt, Guinea, Haiti, Honduras, Tunisia, etc. + The poorest suffer most and do so silently + Inflation and macro-economic imbalances + Environmental sustainability consequences Energy security risks Political security risks Food security risks
Overview • Price developments and causes • Impacts on the poor and hungry • Priorities for action
The food crisis is not overcome, actions are needed now IFPRI’s proposal: • Emergency package: for immediate food assistance and availability needs [Implement immediately] • Resilience package: to meet ongoing and future challenges in the food system [Phase in now for future impact]
Policy actions: Emergency package 1. Expand emergency and humanitarian assistance International (price indexed) and national 2. Eliminate agricultural export restrictions Reduces price levels by up to 30% 3. Fast-impact production programs in key areas Poorest 50% of farmers in Africa - partly publicly funded = US$2.3 billion per annum 4. Change grain and oil seeds bio-fuel policies Reduces maize price 20%, wheat 10%
Policy actions: Resilience package 5. Calm markets with: Market-oriented regulation of speculation Establish global (virtual) grain bank 6. Invest in social protection Focus on child nutrition, women, and poorest 7. Investments for sustained agric. growth Global incremental public agric. investment for MDG1 = US$14 billion per annum 8. Complete the WTO Doha Round Strengthen rule based trade
Improved information and monitoring needed • Information is not available: • Everywhere • Quickly enough • At the needed level of disaggregation • Information strengthening and monitoring needed through: • Internet-based portal • Capacity-strengthening toolbox • Facilitation of fast data collection and estimations Source: Benson et al. IFPRI 2008.
Implementation of actions must be sound Country-driven and -owned programs – with prioritization and sequencing Costs: Face the high investment needed; the benefits for people, growth, security are huge New international governance architecture of agriculture, food, and nutrition needed Accountability at international and national levels: independent monitoring and assessment