Download
1 / 37
370 likes | 749 Vues
YouTube Traffic Characterization: A View From the Edge. Phillipa Gill¹ , Martin Arlitt²¹, Zongpeng Li¹, Anirban Mahanti³ ¹ Dept. of Computer Science, University of Calgary, Canada ² Enterprise Systems & Software Lab, HP Labs, USA ³ Dept. of Computer Science and Engineering, IIT Delhi, India.

E N D
YouTube Traffic Characterization: A View From the Edge Phillipa Gill¹, Martin Arlitt²¹, Zongpeng Li¹, Anirban Mahanti³ ¹Dept. of Computer Science, University of Calgary, Canada ²Enterprise Systems & Software Lab, HP Labs, USA ³Dept. of Computer Science and Engineering, IIT Delhi, India
Introduction • The way people use the Web is changing. • Creation and sharing of media: • Fast, easy, cheap! • Volume of data associated with extremely popular online media.
What is Web 2.0? • User generated content • Text: Wordpress, Blogspot • Photos: Flickr, Facebook • Video: YouTube, MySpace • Social Networking • Facebook, MySpace • Tagging • Flickr, YouTube
YouTube: Facts and Figures • Founded in February 2005 • Enabled users to easily share movies by converting them to Flash • Largest video sharing Website on the Internet [Alexa2007] • Sold to Google for $1.65 billion in November 2006
How YouTube Works (1/2) GET: /watch?v=wQVEPFzkhaM OK (text/html) GET: /vi/fNaYQ4kM4FE/2.jpg OK (img/jpeg)
How YouTube Works (2/2) GET: swfobject.js OK (application/x-javascript) GET: /p.swf OK (application/shockwave-flash) GET: /get_video?video_id=wQVEPFzkhaM OK (video/flv)
Our Contributions • Efficient measurement framework • One of the first extensive characterizations of Web 2.0 traffic • File properties • File access patterns • Transfer properties • Implications for network and content providers
Outline • Introduction & Background • Contributions • Methodology • Results • Implications • Conclusions
Our View Points • Edge (University Campus) • 28,000 students • 5,300 faculty & staff • /16 address space • 300Mb/s full-duplex network link • Global • Most popular videos
Campus Data Collection • Goals: • Collect data on all campus YouTube usage • Gather data for an extended period of time • Protect user privacy • Challenges: • YouTube’s popularity • Monitor limitations • Volume of campus Internet usage
Our Methodology • Identify servers providing YouTube content • Use bro to summarize each HTTP transaction in real time • Restart bro daily and compress the daily log • Map visitor identifier to a unique ID
Categories of Transactions • Complete – the entire transaction was parsed successfully • Interrupted – TCP connection was reset • Gap – monitor missed a packet • Failure – transaction could not be parsed
Global Data Collection • Crawling all videos is infeasible • Focus on top 100 most popular videos • Four time frames: daily, weekly, monthly and all time. • 2 step data collection: • Retrieve pages of most popular videos • Use YouTube API to get details on these videos
Outline • Introduction & Background • Contributions • Methodology • Results • Implications • Conclusions
Results • Campus Usage Patterns • File Properties • File Access Patterns • Transfer Properties
Campus Usage Patterns Reading Break
Results • Campus Usage Patterns • File Properties • File Access Patterns • Transfer Properties
Unique File Sizes • Video data is significantly larger than the other content types
Time Since Modification • Videos and images rarely modified • Text and application data modified more frequently
Video Durations • Spike around 3 minutes likely music videos • Campus videos are relatively short: μ=3.3 min
Summary of File Properties • Video content is much larger than other content types • Image and video content is more static than application and text content • Video durations are relatively short Videos viewed on campus tend to be more than 1 month old
Results • Campus Usage Patterns • File Properties • File Access Patterns • Transfer Properties
Relative Popularity of Videos • Video popularity follows a weak Zipf distribution • Possibly due to edge network point of view β = 0.56
Commonality of Videos • ~10% commonality between consecutive days during the week • ~5% commonality between consecutive days on the weekend
Summary of File Referencing • Zipf distribution is weak when observed from the edge of the network • There is some overlap between videos viewed on consecutive days • Significant amount of content viewed on campus is non-unique
Results • Campus Usage Patterns • File Properties • File Access Patterns • Transfer Properties
Transfer Sizes Flash player (p.swf, player2.swf) Javascripts
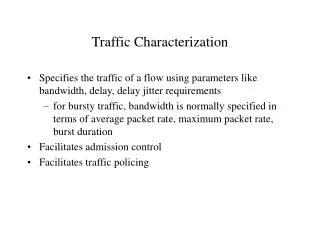
Transfer Durations • Video transfers have significantly longer durations than other content types
Summary of Transfer Properties • Javascript and flash objects have an impact on the size of files transferred • Video transfers have significantly larger sizes and durations
Outline • Introduction & Background • Contributions • Methodology • Results • Implications • Conclusions
Implications for Network Providers • Web 2.0 poses challenges to caching • Larger multimedia files • More diversity in content • Meta data may be used to improve caching efficiency
Implications for Content Providers • Multimedia content is large! • 65,000 videos/day x 10MB/video = 19.5 TB/month • Long tail effect -> much of the content will be unpopular • Cheap storage solutions • Longer transfer durations for video files • more CPU cycles required for transfers
Conclusions • Multimedia content has much larger transfer sizes and durations than other content types • From the edge of the network, video popularity follows a weak Zipf distribution • Web 2.0 facilitates diversity in content which poses challenges to caching • New approaches are needed to efficiently handle the resource demands of Web 2.0 sites
Questions? Contact psessini@ucalgary.ca