Download
1 / 28
300 likes | 766 Vues
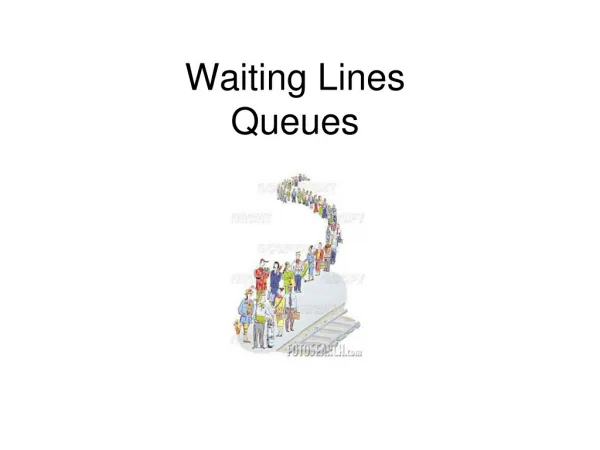
Operations Management Waiting Lines. Example: A Deterministic System. Questions: Can we process the orders? How many orders will wait in the queue? How long will orders wait in the queue? What is the utilization rate of the facility?. A Deterministic System: Example 1.

E N D
Example: A Deterministic System • Questions: • Can we process the orders? • How many orders will wait in the queue? • How long will orders wait in the queue? • What is the utilization rate of the facility?
Utilization • Arrival rate = 1/10 per minutes • Processing rate = time 1/9 per minute • Utilization – AR/PR = (1/10)/(1/9) = 0.9 or 90% • On average 0.9 person is in the system
Known but Uneven Demand: Example 2 • What if arrivals are not exactly every 10 minutes? • Let’s open the spreadsheet.
A Deterministic System: Example 2 Observations: • Utilization is below 100% (machine is idle 14% of the time). • There are 1.12 orders (on average) waiting to be processed.
A Deterministic System: Example 2 • Why do we have idleness (low utilization) and at the same time orders are waiting to be processed? • Answer: Variability
Known but Uneven Demand: Example 2 • How to measure variability? • Coefficient of variation: CV = Standard Deviation / Mean
Uncertain Demand (Interarrival times): Example 3 • The interarrival time is either 5 periods with probability 0.5 or 15 periods with probability 0.5 • Notice that the mean interarrival time is 10. (mean interarrival = 0.5 * 15 + 0.5 * 5 = 10) • The service time is 9 periods (with certainty). • The only difference between example 3 and 1 is that the interarrival times are random.
Simulation of Uncertain Demand (Inter-arrival times): Example 3
Uncertain Demand (Interarrival times): Example 3 (Recall that in Example 1, no job needed to wait.)
Uncertain Demand (Inter-arrival times): Example 3 • Suppose we change the previous example and assume: • Inter-arrival time 17 0.5 probability • Inter-arrival time 3 0.5 probability • Average inter-arrival times as before 10 min.
Uncertain Demand (Interarrival times): Example 3 The effect of variability: higher variability in inter-arrival times results in higher average # in queue.
Can we reduce demand variability/uncertainty? • Can we manage demand? • What are other sources of variability/uncertainty?
Uncertain Demand (Inter-arrival times) • Up to now, our service time is exactly 9 minutes. • What will happen to waiting-line and waiting-time if we have a short service time (i.e., we have a lower utilization rate)? • What will happen if our service time is longer than 10 minutes?
Key Concepts and Issues • The factors that determine the performance of the waiting lines: • Variability • Utilization rate • Risk pooling effect
Rule 1 • In general, if the variability, or the uncertainty, of the demand (arrival) or service process is large, the queue length and the waiting time are also large.
Rule 2 • As the utilization increases the waiting time and the number of orders in the queue increases exponentially.
Rule 3 • In general, pooling the demand (customers) into one common line improves the performance of the system.
Arrival Rate at an Airport Security Check Point What is the queue size? What is the capacity utilization?
Flow Times with Arrival Every 6 Secs What is the queue size? What is the capacity utilization?
Flow Times with Arrival Every 6 Secs What is the queue size? What is the capacity utilization?
Flow Times with Arrival Every 6 Secs What is the queue size? What is the capacity utilization?