Download
1 / 12
120 likes | 512 Vues
(1) Department of Physics and Astronomy, Rice University, Houston, TX ... electron number density, as inferred from dynamic spectrogram data recorded by the Polar Plasma Wave ...

E N D
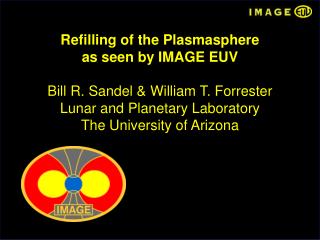
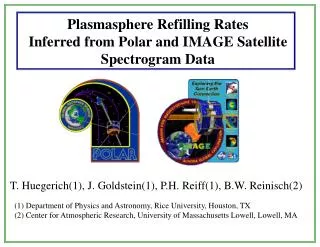
1. Plasmasphere Refilling Rates Inferred from Polar and IMAGE Satellite Spectrogram Data
T. Huegerich(1), J. Goldstein(1), P.H. Reiff(1), B.W. Reinisch(2) (1) Department of Physics and Astronomy, Rice University, Houston, TX (2) Center for Atmospheric Research, University of Massachusetts Lowell, Lowell, MA
2. Plasmasphere Refilling Rates Inferred from Polar and IMAGE Satellite Spectrogram Data
Timothy Huegerich1, Jerry Goldstein1, Patricia H. Reiff1, and Bodo W. Reinisch2
3. Observing Refilling from Polar Orbit
Subsequent Plasmasphere Profiles Exhibit Refilling (Carpenter-Anderson model for the saturated values shown in orange.)
4. Orbital Path Through the Plasmasphere
The Polar satellite passes through the plasmasphere on each 17-18 hour orbit. Each pass consists of an inbound pass through one latitudinal slice of the plasmasphere and an outbound pass through the opposite side of the plasmasphere.
5. Matching Subsequent Passes of Polar through the Co-Rotating Plasmasphere
View of co-rotating plasmasphere from above (EUV perspective), with satellite passes marked. View of satellite passes through the co-rotating plasmasphere
6. Matching Subsequent Passes of IMAGE through the Co-Rotating Plasmasphere
View of satellite passes through the co-rotating plasmasphere View of co-rotating plasmasphere from above (EUV perspective), with satellite passes marked.
7. Measuring Flux Tube Refilling
Picture of plasmasphere profiles from slide 3 with bins drawn. Aligned below: calculations of (change in density)/time Explain that we know refilling may not be occuring the whole time.
8. Applying Rasmussen Refilling Model
Rasmussen has developed a simple model for the rate of plasmasphere refilling: Where is a constant with the units of time that we wish to calculate for different events, seeking to find its dependence on L, Kp, or other factors. From two subsequent measures of electron density in a given flux tube, and a value for the electron density of a saturated flux tube, we may calculate as:
9. Case Studies: January 15, 1997
10. Case Studies: October 5, 1996
11. Case Studies: November 27, 2001
12. Case Studies: June 5, 2001