Download
1 / 11
110 likes | 465 Vues
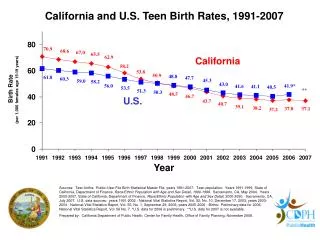
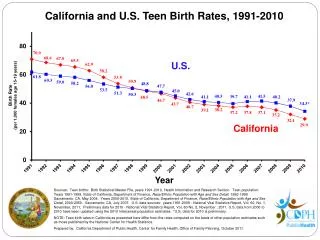
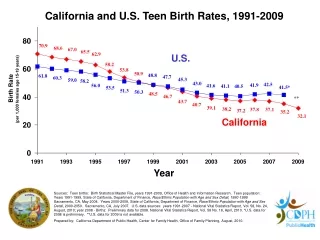
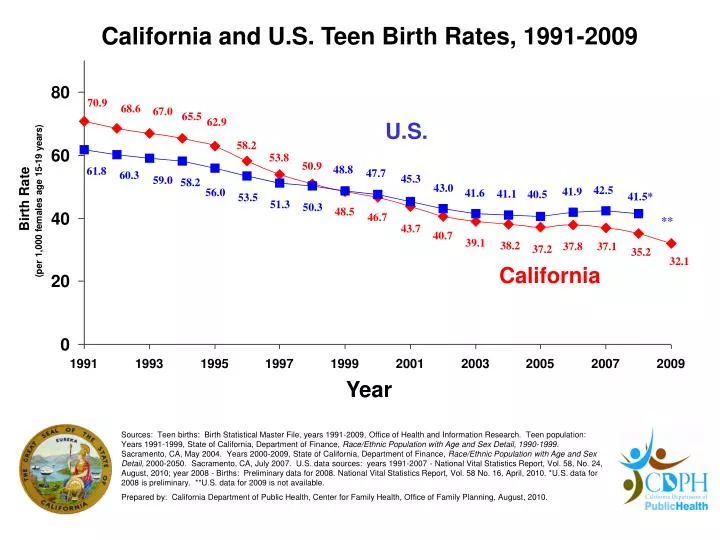
California and U.S. Teen Birth Rates, 1991-2009. U.S. **. California. Year.

E N D
California and U.S. Teen Birth Rates, 1991-2009 U.S. ** California Year Sources: Teen births: Birth Statistical Master File, years 1991-2009, Office of Health and Information Research. Teen population: Years 1991-1999, State of California, Department of Finance, Race/Ethnic Population with Age and Sex Detail, 1990-1999. Sacramento, CA, May 2004. Years 2000-2009, State of California, Department of Finance, Race/Ethnic Population with Age and Sex Detail, 2000-2050. Sacramento, CA, July 2007. U.S. data sources: years 1991-2007 - National Vital Statistics Report, Vol. 58, No. 24, August, 2010; year 2008 - Births: Preliminary data for 2008. National Vital Statistics Report, Vol. 58 No. 16, April, 2010. *U.S. data for 2008 is preliminary. **U.S. data for 2009 is not available. Prepared by: California Department of Public Health, Center for Family Health, Office of Family Planning, August, 2010.
California Teen Birth Rates, 1998-2009 Ages 18-19 Ages 15-19 Ages 15-17 Year Sources: Teen births: Birth Statistical Master File, years 1998-2009, Office of Health and Information Research. Teen population: Years 1998-1999, State of California, Department of Finance: Race/Ethnic Population with Age and Sex Detail, 1990-1999. Sacramento, CA, May 2004. Years 2000-2009, State of California, Department of Finance: Race/Ethnic Population with Age and Sex Detail, 2000-2050. Sacramento, CA, July 2007. Prepared by: California Department of Public Health, Center for Family Health, Office of Family Planning, August, 2010.
California Teen Birth Rates by Race/Ethnicity & Year, 2007-2009 Race/Ethnicity Sources: Teen births: Birth Statistical Master File, years 2007-2009, Office of Health and Information Research. Teen population: State of California, Department of Finance: Race/Ethnic Population with Age and Sex Detail, 2000-2050. Sacramento, CA, July 2007, years 2007-2009. Births to mothers identified as “other” or “unknown” race are excluded from the analysis. For 2007 they comprised 0.98% of teen births, 1.1% in 2008 and 1.2% in 2009. Prepared by: California Department of Public Health, Center for Family Health, Office of Family Planning, August 2010.
19 California Counties With 3-Year Average Teen Birth Rates* Significantly HIGHER Than the 3-Year Average StateTeen Birth Rate, 2007-2009**, Highest to Lowest • Santa Barbara (42.3) • Yuba (41.9) • Lake (41.8) • San Joaquin (41.6) • Stanislaus (40.6) • Riverside (39.0) • Kern (62.8) • Tulare (62.1) • Kings (59.5) • Madera (57.7) • Imperial (55.5) • Monterey (54.8) • Fresno (54.4) • Merced (51.0) • Glenn (45.3) • San Bernardino (44.6) • Colusa (44.6) • Del Norte (44.4) • Tehama (43.1) Sources: Teen births: Birth Statistical Master File, years 2007-2009, Office of Health and Information Research. Teen population: State of California, Department of Finance: Race/Ethnic Population with Age and Sex Detail, 2000-2050. Sacramento, CA, July 2007. *Teen birth rate is per 1,000 females age 15-19 years. **The number of teen births and the teen female population for 3 years (2007-2009) were combined to produce more stable rates. County rates were tested for statistical significance against the state rate after subtracting the county’s contribution to the rate. County rates not statistically significantly different from the remaining state rate include Inyo, Mendocino, Modoc, Sacramento, San Benito, Santa Cruz, Shasta, Siskiyou, Sutter, Trinity, and Ventura. Stable rates could not be computed for Alpine and Sierra (fewer than 20 births). Prepared by: California Department of Public Health, Center for Family Health, Office of Family Planning, August, 2010.
26 California Counties With 3-Year Average Teen Birth Rates* Significantly LOWER Than the 3-Year Average StateTeen Birth Rate, 2007-2009**, Highest to Lowest • Los Angeles (33.9) • San Diego(33.1) • Solano (29.5) • Humboldt(28.3) • Lassen (27.8) • Butte (27.6) • Tuolumne (26.5) • Orange (25.7) • Alameda (25.7) • Napa(24.9) • Santa Clara (23.8) • Sonoma (23.2) • San Francisco (22.2) • Amador (21.6) • Contra Costa (21.4) • Calaveras (21.4) • Plumas (21.2) • San Mateo (20.9) • Yolo (20.6) • San Luis Obispo (20.0) • Mariposa (19.6) • Mono (16.7) • El Dorado (16.0) • Nevada(14.5) • Placer (13.5) • Marin (12.0) Sources: Teen births: Birth Statistical Master File, years 2007-2009, Office of Health and Information Research. Teen population: State of California, Department of Finance: Race/Ethnic Population with Age and Sex Detail, 2000-2050. Sacramento, CA, July 2007. *Teen birth rate is per 1,000 females age 15-19 years. **The number of teen births and the teen female population for 3 years (2007-2009) were combined to produce more stable rates. County rates were tested for statistical significance against the state rate after subtracting the county’s contribution to the rate. County rates not statistically significantly different from the remaining state rate include Inyo, Mendocino, Modoc, Sacramento, San Benito, Santa Cruz, Shasta, Siskiyou, Sutter, Trinity, and Ventura. Stable rates could not be computed for Alpine and Sierra (fewer than 20 births). Prepared by: California Department of Public Health, Center for Family Health, Office of Family Planning, August, 2010.
Sources: Birth Statistical Master Files, 2007-2009, Office of Health and Information Research. Teen population: Years 2007-2009, State of California, Department of Finance: Race/Ethnic Population with Age and Sex Detail, 2000-2050. Sacramento, CA, July 2007. Prepared by: The Bixby Center for Global Reproductive Health, University of California, San Francisco, for California Department of Public Health, Center for Family Health, Office of Family Planning, August, 2010.
21 States with Teen Birth Rates LOWER Than California’s Rate (37.1 per 1,000 females age 15-19 years), 2007, Highest to Lowest • • Montana (36.8) • • Nebraska (36.1) • • Utah (36.1) • • Oregon (35.9) • • Virginia (35.1) • • Washington (34.8) • Maryland (34.4) • • Michigan (34.2) • • Iowa (33.2) • • Wisconsin (32.2) • • Pennsylvania (31.5) • Rhode Island (30.0) • North Dakota (29.3) • Minnesota (28.6) • Maine (26.9) • New York (25.8) • New Jersey (25.2) • Connecticut (23.1) • Massachusetts (22.1) • Vermont (22.0) • New Hampshire (20.0) California Rate: Teen births: Birth Statistical Master File, 2007, Office of Health and Information Research. Teen population: State of California, Department of Finance: Race/Ethnic Population with Age and Sex Detail, 2000-2050. Sacramento, CA, July 2007.Rates for Other States: National Vital Statistics Reports; Vol. 58, No. 24, August, 2010. Prepared by: California Department of Public Health, Center for Family Health, Office of Family Planning, August, 2010.
Teen Birth Rate Comparisons for California, US, and SelectedCountries – 2008 * California data sources: Teen births: Birth Statistical Master File, 2008, Office of Health and Information Research. Teen population: State of California, Department of Finance: Race/Ethnic Population with Age and Sex Detail, 2000-2050. Sacramento, CA, July 2007. * U.S. Data source: Births: Preliminary data for 2008. National Vital Statistics Report, Vol. 58 No. 16, April, 2010. International data: The World Bank Group, Health Nutrition & Population Statistics data by country. URL: http://web.worldbank.org/WBSITE/EXTERNAL/TOPICS/EXTHEALTHNUTRITIONANDPOPULATION/EXTDATASTATISTICSHNP/EXTHNPSTATS/0,,menuPK:3237172~pagePK:64168427~piPK:64168435~theSitePK:3237118,00.html Prepared by: California Department of Public Health, Center for Family Health, Office of Family Planning, August, 2010.
Teen Maternal Race/Ethnicity (n=47,811) & Nativity of Select Teen Births for Females Age 15-19 years, California, 2009 Other/Unknown* (non-Hispanic) 1.2% White (non-Hispanic) 12.5% Multiple Race (non-Hispanic) 2.4% African American (non-Hispanic) 7.8% American Indian (non-Hispanic) 0.5% Hispanic 72.9% (29% foreign born, 71% US born) Asian/Pacific Islander (non-Hispanic) 2.7% (29% foreign born, 71% US born) Sources: Teen births: Birth Statistical Master File, 2009, Office of Health and Information Research. Percentages may not add to 100% due to rounding. Births to mothers with unknown race/ethnicity (1.2%) are included in the analysis. Prepared by: California Department of Public Health, Center for Family Health, Office of Family Planning, August, 2010.
California Teen Birth Rates, Number of Teens,& Number of Teen Births, 1998-2009 50.9 1,488,207 1,142,240 32.1 58,141 47,811 Year Teen birth rate: Teen births: Birth Statistical Master File, years 1998-2009, Office of Health and Information Research. Teen population: Years 1998-1999, State of California, Department of Finance, Race/Ethnic Population with Age and Sex Detail, 1990-1999. Sacramento, CA, May 2004. Years 2000-2009, State of California, Department of Finance, Race/Ethnic Population with Age and Sex Detail, 2000-2050. Sacramento, CA, July 2007. Number of teens: Years 1998-1999, State of California, Department of Finance, Race/Ethnic Population with Age and Sex Detail, 1990-1999. Sacramento, CA, May 2004. Years 2000-2009, State of California, Department of Finance, Race/Ethnic Population with Age and Sex Detail, 2000-2050. Sacramento, CA, July 2007. Number of teen births: Birth Statistical Master File, years 1998-2009. Prepared by: California Department of Public Health, Center for Family Health, Office of Family Planning, August, 2010.
Number of Female Teens by Race/Ethnicity, Age 15-19 Years, California, 2000-2010 Total - 1,488,238 25% increase Total - 1,186,951 Number of teens: Years 2000-2010, State of California, Department of Finance, Race/Ethnic Population with Age and Sex Detail, 2000-2050. Sacramento, CA, July 2007. “All Other” race/ethnicity population is comprised of American Indian and Multiple Race female teens. Prepared by: California Department of Public Health, Center for Family Health, Office of Family Planning, August, 2010.