Download
1 / 21
270 likes | 1.27k Vues
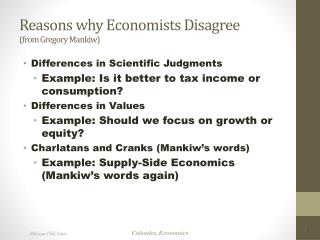
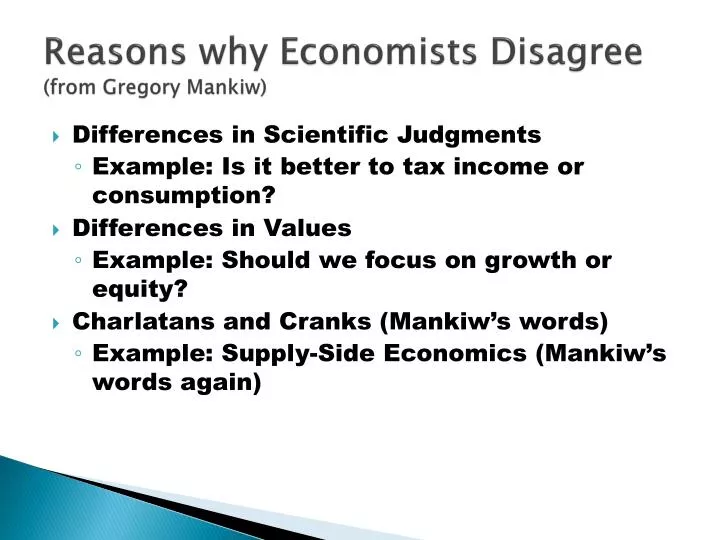
Reasons why Economists Disagree (from Gregory Mankiw ). Differences in Scientific Judgments Example: Is it better to tax income or consumption? Differences in Values Example: Should we focus on growth or equity? Charlatans and Cranks (Mankiw’s words)

E N D
Reasons why Economists Disagree(from Gregory Mankiw) • Differences in Scientific Judgments • Example: Is it better to tax income or consumption? • Differences in Values • Example: Should we focus on growth or equity? • Charlatans and Cranks (Mankiw’s words) • Example: Supply-Side Economics (Mankiw’s words again)
Economists in Agreement From Gregory Mankiw http://gregmankiw.blogspot.com/2009/02/news-flash-economists-agree.html
The Penn World Tables and EH.NET • http://pwt.econ.upenn.edu/php_site/pwt_index.php • http://www.measuringworth.org/usgdp/
The work of Ray Fair • http://fairmodel.econ.yale.edu/ • http://fairmodel.econ.yale.edu/vote2008/index2.htm • http://fairmodel.econ.yale.edu/RAYFAIR/PDF/2006CHTM.HTM
Reconcile the following empirical observations: - Most unemployment spells are of short-duration. - Most people unemployed at any given time have been unemployed for a long-duration • Example: • In one year, 2 people are unemployed • Each month, 2 people lose a job and find one at the end of the month • At any given time, how many people have been unemployed for a long time? • Over the year, how many people were unemployed for a short period of time?
A bit of inflation history • Period % Change in Money Supply % Change in Price Level • ‑‑‑‑‑‑‑ ‑‑‑‑‑‑‑‑‑‑‑‑‑‑‑‑‑‑‑‑‑‑ ‑‑‑‑‑‑‑‑‑‑‑‑‑‑‑‑‑‑‑‑‑ • 1834‑37 + 61 + 28 • 1837‑43 ‑ 58 ‑ 35 • 1843‑48 + 102 + 9 • 1848‑49 ‑ 11 0 • 1849‑54 + 109 + 32 • 1854‑55 ‑ 12 + 2 • 1855‑57 + 18 + 1 • 1857‑58 ‑ 23 ‑ 16 • 1858‑61 + 35 ‑ 4 • (Sources: John Knox, A History of Banking in the United States, New York: Bradford Rhodes, 1903; and Historical Statistics, 1960, series E1‑12.)
The CPI(from Mankiw) • A measure of the overall level of prices • Published by the Bureau of Labor Statistics (BLS) • Uses: • tracks changes in the typical household’s cost of living • adjusts many contracts for inflation (“COLAs”) • allows comparisons of dollar amounts over time
Problems with CPI(from Mankiw) • Substitution bias: The CPI uses fixed weights, so it cannot reflect consumers’ ability to substitute toward goods whose relative prices have fallen. • Introduction of new goods: The introduction of new goods makes consumers better off and, in effect, increases the real value of the dollar. But it does not reduce the CPI, because the CPI uses fixed weights. • Unmeasured changes in quality: Quality improvements increase the value of the dollar, but are often not fully measured.
Unemployment and Inflation • A.W. Phillips. “The Relation Between Unemployment and the Rate of Change of Money Wage Rates in the United Kingdom, 1861-1957.” Economica, November, 1958. • This work gave us the Phillips Curve, or the negative relationship between unemployment and inflation.
Inflation Vs Unemployment in the United States, 1900-1960 • During the period 1900-1960 in the United States, a low unemployment rate was typically associated with a high inflation rate, and a high unemployment rate was typically associated with a low or negative inflation rate.
Inflation versus Unemployment in the United States, 1948-1969 • The steady decline in the U.S. unemployment rate throughout the 1960s was associated with a steady increase in the inflation rate. • This is the negative relation between unemployment and inflation that A.W. Phillips found for the United Kingdom, and Robert Solow and Paul Samuelson found for the United States (or the original Phillips curve).
In the 1970s life changed... • Beginning in 1970, the relation between the unemployment rate and the inflation rate disappeared in the United States. • Inflation versus Unemployment in the United States, 1970-2000 (next slide)
Consumption (C) (from Gregory Mankiw) definition: The value of all goods and services bought by households. Includes: • durable goodslast a long time ex: cars, home appliances • nondurable goodslast a short time ex: food, clothing • serviceswork done for consumers ex: dry cleaning, air travel.
U.S. consumption, 2005 (from Gregory Mankiw) $ billions % of GDP Consumption Durables 1,026.5 8.2 Nondurables 2,564.4 20.5 Services 5,154.9 41.3 $8,745.7 70.0% CHAPTER 2 The Data of Macroeconomics
Investment (I) (from Gregory Mankiw) Definition 1: Spending on [the factor of production] capital. Definition 2: Spending on goods bought for future use Includes: • business fixed investmentSpending on plant and equipment that firms will use to produce other goods & services. • residential fixed investmentSpending on housing units by consumers and landlords. • inventory investmentThe change in the value of all firms’ inventories.
U.S. investment, 2005 (from Gregory Mankiw) $ billions % of GDP Investment Business fixed 1,329.8 10.6 Residential 756.3 6.1 Inventory 18.9 0.2 $2,105.0 16.9% CHAPTER 2 The Data of Macroeconomics
U.S. government spending, 2005(from Gregory Mankiw) 877.7 7.0 290.6 2.3 587.1 4.7 1,485.2 11.9 $ billions % of GDP Govt spending $2,362.9 18.9% Federal Non-defense Defense State & local CHAPTER 2 The Data of Macroeconomics
Net exports: NX = EX – IM (from Gregory Mankiw) def: The value of total exports (EX) minus the value of total imports (IM).
Why output = expenditure (from Gregory Mankiw) • Unsold output goes into inventory, and is counted as “inventory investment”… …whether or not the inventory buildup was intentional. • In effect, we are assuming that firms purchase their unsold output.