Download
1 / 32
330 likes | 662 Vues
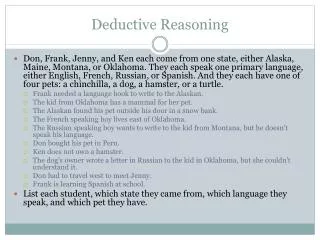
COMP 3503 Deductive Modeling with OLAP. with Daniel L. Silver. Agenda. What is OLAP? OLAP, MOLAP and ROLAP OLAP Functionality Overview of IBM Cognos Insight OLAP Pros and Cons. What is OLAP?. On-Line Analytical Processing. OLAP

E N D
COMP 3503Deductive Modeling with OLAP with Daniel L. Silver
Agenda • What is OLAP? • OLAP, MOLAP and ROLAP • OLAP Functionality • Overview of IBM Cognos Insight • OLAP Pros and Cons
On-Line Analytical Processing OLAP • Term coined by E.F. Codd in a document published in 1993 sponsored by Arbor Software Corp (ESSBASE) • In contrast to OLTP and traditional RDBMS • Defined requirements for databases and tools to implement decision support and business intelligence systems. • Has had a significant impact on the database and business software market.
OLAP Definition • Online Analytical Processing = OLAP refers to technology that allows users of multidimensional databases to generate on-line descriptive or comparative summaries ("views") of data and other analytic queries. • OLAP facilities should be integrated into enterprise-wide data base systems • allow analysts and managers to monitor the performance of the business • e.g. –number of transactions / sales at different locations by product class by time Courtesy Anders Stjarne
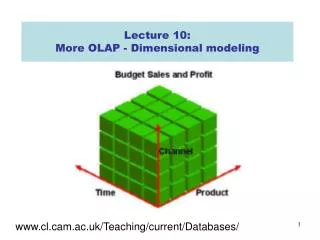
Multidimensional Requirements • Example: Sales volume as a function of product, time, and geography. More than three dimensional data cube is referred to as a hypercube Geography Dimensions: Product, Geography, Time Measure:‘Sales Volume’ Product Time Courtesy Anders Stjarne
Comprehensive Sales Analysis When? Time (1997) Who? Customers (Channels) What? Product (Type) Where? Location (Region) Result? Indicator (Revenue) Combination 1 Quarter Month Type Customer Line Brand Number Country Branch Sales Rep Quantity Cost Margin Combination 2 Quarter Month Type Customer Line Brand Number Country Branch Sales Rep Quantity Cost Margin Deductive Modelling and Analysis q Courtesy Anders Stjarne
Multi-dimensional - data-cubes or hypercubes Transparent access Navigation aids Consistent reporting Client-sever based Generic dimensionality Efficient data storage Multi-user support Unrestricted cross-dimensional operations Intuitive data manipulation Flexible reporting Unlimited levels of aggregation On-Line Analytical Processing12 Rules of an OLAP Environmentby E.F. Codd
On-Line Analytical Processing • Strong connection to multi-dimensional database (MDBMS) model MOLAP • Data-cubes are typically constructed off-line due to time required to build indices • Dimensions, values, and aggregations are limited to that within data-cube • On-line cube development has allowed RDBMS vendors to survive as major players in OLAP market ROLAP
OLAP Distributed Framework OLAP functions are independent of: • Front-end user interface • Back-end data storage Courtesy Anders Stjarne
MDBMS • Relational versus Dimensional Data • http://www.youtube.com/watch?v=FjKaRU5V1Rw • ROLAP = Representing dimensional data with RDBMS • Star Schema • http://www.dwreview.com/OLAP/Introduction_OLAP.html • More details: • http://www.youtube.com/watch?v=1Qdf5c_nmtw • http://www.ciobriefings.com/Publications/WhitePapers/DesigningtheStarSchemaDatabase/tabid/101/Default.aspx
MOLAP vs. ROLAP Relational • multidimensional view built on a Relational DBMS • hampered by the limitations of SQL • handles sparcity automatically • stores summary and detail data equally easily • easy to share common dimensions across DWs • scales well using well-developed relational technology • depends on efficient processing of STAR joins and indexes • analytical processing done on the client (or middle server) Multidimensional • difficulty handling sparcity efficiently • direct representation of the data “cube” • rapid drill down on summary data • proprietary solutions • better performance response • does not scale well to handle large amounts of detail • thin client, analytical processing done on server REF: White, “MOLAP vs ROLAP,” (B&A-15) Courtesy Anders Stjarne
On-Line Analytical Processing Deductive Modeling with OLAP • Model is developed within the users mind as data is explored • Verification or rejection is facilitated by multi-dimensional functions which display data numerically and graphically • Best practices: • Determine suspected variable interaction • Verify/reject model through exploration • Drill-down to refine model • Maintain record of exploratory findings
On-Line Analytical Processing Basic OLAP Functionality • Dimension selection - slice & dice • Rotation - allows change in perspective • Filtration -value range selection • Hierarchies of aggregation levels • drill-downs to lower levels • roll-ups to higher levels Tremendous tool for decision support and executive information delivery and analysis
OLAP - Sample Operations • Roll up: summarize data • total sales volume last year by product category by region • Roll down, drill down, drill through: go from higher level summary to lower level summary or detailed data • For a particular product category, find the detailed sales data for each salesperson by date • Slice and dice: select and project • Sales of beverages in the West over the last 6 months • Pivot or rotate: change visual dimensions Courtesy Anders Stjarne
OLAP and Data Mining • The final results from OLAP exploration can lead to inductive data mining • Data Mining techniques can be applied to the data views and summaries generated by OLAP to provide more in-depth and often more multidimensional knowledge • Data Mining techniques can be considered analytic extension of OLAP
Multi-dimensional Cubes • A cube is a structure that stores data multi-dimensionally and provides: • secure data access • fast retrieval of data. • Cubes can be distributed across a network or to individual computers. q
Basic % # Derived Revenue - Cost = Profit Margin Measures • The numeric (continuous) data that is collected and stored by your organization. • The performance measures used to evaluate your business. Examples: • Revenue • Cost • Quantity sold • Units on-hand • Hours per Job • Number of calls • Defective units. q
Years Region Product Type Branch Days Months Country Line When? Date What? Products Where? Locations Dimensions Levels Dimensions and Levels • Dimensions are a broad group of descriptive data about the major aspects of your business. • Levels represent established hierarchy within dimensions. q Courtesy Anders Stjarne
Locations Region Europe Country United Kingdom London, U.K. Manchester, U.K. Branch Levels and Categories • A category is a data item that populates a level in a dimension. Dimension Categories Levels q Courtesy Anders Stjarne
Application Development Process Plan measures and dimensions Obtain the required data Develop the MDBMS model Create the cube Explore the cube data using Insight q Courtesy Anders Stjarne
Basic OLAP Operations • Selection (Filter) – within the range of a dimension • Scope – the range on a dimension • Slice – a two dimensional ‘page’ from the cube • Dice – chopping up along the dimensions • Drill down analysis - to the detail beneath summary data • Rollup/ Consolidate • Rotate (Pivot) – change dimension orientation • Swap rows and columns • Swap on or off • Change nesting order • Reach Through – to the source data detail • Calculations / Derivation formulas on the measured facts • Ratios, Rankings, etc. • E.g., NetSales = GrossSales – Cost; NetSales = GrossSales*(1 - Margin) REFS: INMON, Building, Ch. 7, p. 243; White, “MOLAP vs ROLAP,” (B&A-15) Courtesy Anders Stjarne
Advanced OLAP Operations • Trend analysis - over broad vistas of time • handling time series data, time calculations • Key ratio indicator measurement and tracking • Comparisons - present to: past, plan, and others • competitive market analysis • Problem monitoring - of variables within control limits • Alerts and Event-Driven Agent Processing Courtesy Anders Stjarne
On-Line Analytical Processing Strengths of OLAP • Powerful visualization ability via GUI • Fast, interactive response times • Analysis of time series • Deductive discovery of clusters/exceptions • Many OLAP products available and integrated to DB products
On-Line Analytical Processing Weaknesses of OLAP • Does not handle continuous variables • Does not automatically discover patterns and models • Generation of a complex hypercubes require some training and experience • Hypercube generation and update - MOLAP Vs. ROLAP
On-Line Analytical Processing Products and Suppliers • http://en.wikipedia.org/wiki/Comparison_of_OLAP_Servers
Overview of IBM Cognos Insight OLAP Intro:http://www.youtube.com/watch?v=ugczSGNVXlU In depth:http://www.youtube.com/watch?v=bNw89HUHKEk
Tutorial • IBM Cognos Insight